Mo, 16.11.2026 | Original article from: Rapid Commun. Mass Spectrom. 40, no. 23 (2026): e70175
Nano flow LC-Orbitrap MS increases lipid identifications, reduces in-source fragmentation, and extends sensitivity to much lower sample loads than high-flow LC-MS.Implementation of Nano Flow Chromatography Coupled to Mass Spectrometry as a Reliable and Sensitive Discovery Lipidomics Platform
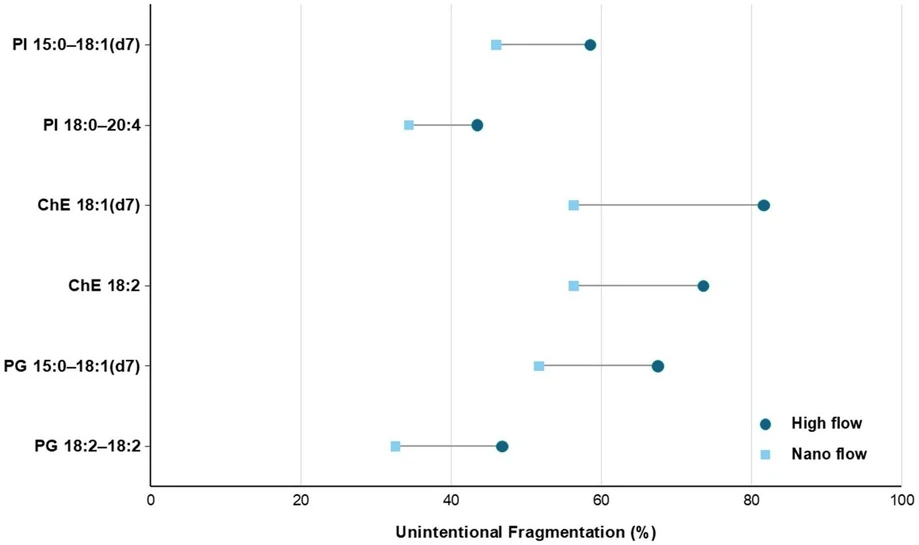
Rapid Commun. Mass Spectrom. 40, no. 23 (2026): e70175: Figure 3: Comparison of unintentional fragmentation under high flow and nano flow LC conditions. Unintentional fragmentation (%) was determined for six lipid species. PI 15:0–18:1(d7), ChE 18:1(d7), and PG 15:0–18:1(d7) were labeled internal standards from SPLASH Lipidomix. PI 18:0–20:4, ChE 18:2, and PG 18:2–18:2 were unlabeled endogenous lipid species. Teal circles represent high flow measurements, and blue squares represent nano flow measurements. Connected points show measurements of the same lipid species under both LC flow conditions.
This study evaluates nano flow liquid chromatography coupled with high-resolution Orbitrap mass spectrometry as a routine platform for untargeted lipidomics. Compared with high-flow LC-MS, nano flow analysis produced more lipid annotations from a fourfold lower on-column sample load and reduced unintentional fragmentation by 21–31%.
Nano flow also extended the lower end of the analytical response range by up to 40-fold for selected lipid standards while reducing solvent consumption. Together with practical guidance for sample preparation, injection, washing, and equilibration, the results support nano flow LC-MS as a sensitive and reliable option for sample-limited discovery lipidomics.
The original article
Implementation of Nano Flow Chromatography Coupled to Mass Spectrometry as a Reliable and Sensitive Discovery Lipidomics Platform
Ciara J. Sallowicz, Thiago Mattos, Rahul R. Deshpande, Bashar Amer, Susan S. Bird
Rapid Commun. Mass Spectrom. 40, no. 23 (2026): e70175
https://doi.org/10.1002/rcm.70175
licensed under CC-BY 4.0
Selected sections from the article follow. Formats and hyperlinks were adapted from the original.
Nano flow LC coupled to electrospray ionization (ESI) mass spectrometry has been applied to lipid analysis since the mid-2000s. Early studies demonstrated sensitive separation and structural characterization of phosphatidylcholines from plant and mammalian tissues [14], as well as broad profiling of phospholipids and glycosphingolipids from glioblastoma cells using nano flow LC coupled to high-resolution FT-ICR and ion-trap MS/MS [15]. More recent work has extended capillary and nano flow lipidomics to high-depth plasma profiling using Orbitrap Tribrid mass spectrometry [16], comprehensive lipid analysis of saliva [17], and profiling of intact glycosphingolipids from human tissue, serum, and cells with automated structural annotation [18]. Collectively, these studies demonstrate the versatility of nano flow LC–MS across lipid classes, biological matrices, and mass spectrometry platforms. The increased sensitivity observed at lower flow rates is supported by improved ESI efficiencies, as smaller droplets can increase charge density and facilitate faster desolvation, whereas fewer analyte molecules within each droplet can reduce ion competition and ion suppression [19]. Nano flow can also reduce in-source fragmentation for some lipid classes, although the extent depends on ion transfer conditions and source parameters, including temperature, radiofrequency (RF) settings, spray configuration, and gas parameters [20, 21]. Together, these effects can increase analytical sensitivity and improve lipid annotation quality when nano flow LC is coupled directly to ESI-MS [13, 19].
In contrast to proteomics workflows, which are commonly performed in the nano flow regime, lipidomics workflows are most often carried out using analytical flow separations [6, 22]. These methods are well established, robust, and compatible with a wide range of commercially available column dimensions and stationary phase chemistries [6, 22]. Continued improvements in mass spectrometer performance have further increased the sensitivity and utility of analytical flow lipidomics workflows [6, 8, 9]. Nevertheless, certain applications may benefit from lower flow separations, particularly when sample amounts are limited, low-abundance lipid species are of interest, or solvent consumption is an important consideration [12, 13]. At the same time, nano flow lipidomics remains more technically challenging to implement than established analytical flow workflows [12, 16, 21]. Nano flow separations require appropriate instrumentation, low dead volume connections, and stable electrospray emitters [12]. Method development is also constrained by the choice of commercially available capillary columns, which mainly feature C18 phases optimized for peptide separations, whereas a broader range of stationary phases, including C30, Shield RP18, and CSH Phenyl-Hexyl, has been explored for lipid analysis at analytical flow rates [16, 22-25]. Implementing a robust nano flow method also requires careful method setup to minimize carryover and gradual buildup, and maintain stable performance [18, 26]. Nano flow lipidomics can deliver sensitivity and solvent-use advantages but is less forgiving from an implementation standpoint [12, 16]. Thus, routine nano flow lipidomics requires additional attention to wash procedures, re-equilibration, low dead volume connections, and source stability [26, 27]. However, many of those practical barriers are becoming less significant as nano LC instrumentation continues to improve. Modern platforms, including the Thermo Scientific Vanquish Neo UHPLC system used in this study, incorporate automated system control and simplified operation that can reduce the level of operational complexity associated with nano flow separations. With appropriate training and standard procedures, nano flow workflows can therefore be implemented more readily in laboratories with existing LC–MS expertise.
In this work, an established high flow lipidomics method was compared with a nano flow LC–MS method using Orbitrap-based HRAM mass spectrometry. The study evaluates the differences in lipid annotation depth, sensitivity, unintentional fragmentation, and analytical response, while also identifying practical considerations for routine nano flow lipidomics.
2. Materials and Methods
2.2 High-Performance Liquid Chromatography
For the bovine liver total lipid extract comparison, nano flow analyses were performed at 5 and 25 ng on-column, whereas high flow analyses were performed at 100 ng on-column. These loading amounts were selected to reflect typical loading ranges reported in previous lipidomics studies [12, 13, 18]. All solvents used for sample preparation, mobile phase preparation, and wash solutions were Fisher Chemical Optima LC–MS grade.
Nano flow liquid chromatography (nLC) separations were performed using a Vanquish Neo UHPLC system in direct-injection mode with pressure control set to 1500 bar, equipped with a Thermo Scientific EASY-Spray C18 column (75 μm × 15 cm, 2 μm) maintained at 45°C. The instrument was configured to begin data acquisition during sample injection.
High flow separations were performed on a Thermo Scientific Vanquish Horizon UHPLC system equipped with a Thermo Scientific Accucore C30 column (2.1 × 150 mm, 2.6 μm) maintained at 45°C. The flow rate was 260 μL/min with a 2.0-μL injection volume, and mobile phases A and B were the same as those used for the nano flow method. The gradient was held at 30% B from 0.0–2.0 min, increased to 43% B at 2.0 min and 55% B at 2.1 min, then ramped to 65% B at 12.0 min, 85% B at 18.0 min, and 100% B at 20.0 min, then held at 100% B from 20.0–25.0 min. The gradient returned to 30% B at 25.1 min and was held at 30% B from 25.1–30.0 min for re-equilibration. The outer needle wash solvent was isopropanol:acetonitrile:water (50:45:5, v/v/v).
2.3 Mass Spectrometry
Mass spectrometry analyses were performed on a Thermo Scientific Orbitrap Excedion hybrid mass spectrometer. Full-scan MS1 data were acquired with polarity switching over m/z 250–1700 at a resolution setting of 120 000 (FWHM) at m/z 200, using an automatic gain control (AGC) target of standard (1e6 absolute AGC), a maximum injection time of 50 ms, and an RF lens value of 50%. High flow analyses used a Thermo Scientific OptaMax Plus H-ESI source with spray voltages of 3.5 kV (positive) and 2.5 kV (negative), sheath gas 40, auxiliary gas 8, ion transfer tube temperature 275°C, and vaporizer temperature 250°C. Nano flow analyses used a Thermo Scientific EASY-Spray source with spray voltages of 1.9 kV (positive) and 1.5 kV (negative) and an ion transfer tube temperature of 275°C.
2.4 Data Analysis
Bovine liver total lipid extract was processed using Thermo Scientific LipidSearch 5.2 software for lipid annotation and relative quantification. Raw files were imported and processed using a consistent workflow across nano flow and high flow datasets. During the alignment step, the lipid peak areas were class-normalized to the corresponding SPLASH internal standard using the known standard amount. Initial output included lipid annotations with any adduct and grade assignments A, B, or C (D grades were pre-filtered out because they lack specific head group and substituent fragment ions). Follow-up filtering was applied using class-specific criteria based on the preferred main ion for each lipid class and the LipidSearch annotation grade. To make the filtering criteria more adaptable to other software platforms, the preferred main ions used for filtering are summarized in Table S1, whereas the complete LipidSearch-specific filter expression, including grade criteria, is provided as Data S1.
For the dilution series, SPLASH standards were evaluated in Thermo Scientific TraceFinder 5.2 software. Integrated peak areas from triplicate injections were plotted against the on-column load for each SPLASH standard on logarithmic axes (log10 scale) using GraphPad Prism 11.0. On-column load was calculated from the concentration of each standard at each dilution level and the injection volume used for each workflow (0.1 μL for nano flow and 2.0 μL for high flow). The response range was selected from consecutive dilution levels that showed a consistent increase in peak area with increasing on-column load and linear behavior on logarithmic axes. Low concentration points showing response flattening or increased replicate variability were excluded.
3. Results and discussion
Minimizing unintentional fragmentation is important in untargeted lipidomics because it can decrease sensitivity and compromise lipid detection [21]. Moreover, the fragment ions formed before intentional MS/MS can overlap in m/z with intact lipid ions, potentially increasing false-positive annotations and reducing annotation confidence [21]. Unintentional fragmentation was evaluated by comparing percent fragmentation for six representative lipids from the PI, ChE, and PG classes under high flow and nano flow conditions (Figure 3). The percentage of unintentional fragmentation was calculated using the S/N of a selected product ion and its corresponding precursor ion, as described in Section 2. Lower unintentional fragmentation was observed with nano flow for all six lipid species evaluated. Fragmentation decreased by 21% for both PI species, 24%–31% for the ChE species, and 23%–30% for the PG species relative to their respective high flow measurements. Overall, the consistent decrease across the representative PI, ChE, and PG lipid species indicates less unintentional fragmentation with the nano flow workflow under the conditions evaluated.
Rapid Commun. Mass Spectrom. 40, no. 23 (2026): e70175: Figure 3 Comparison of unintentional fragmentation under high flow and nano flow LC conditions. Unintentional fragmentation (%) was determined for six lipid species. PI 15:0–18:1(d7), ChE 18:1(d7), and PG 15:0–18:1(d7) were labeled internal standards from SPLASH Lipidomix. PI 18:0–20:4, ChE 18:2, and PG 18:2–18:2 were unlabeled endogenous lipid species. Teal circles represent high flow measurements, and blue squares represent nano flow measurements. Connected points show measurements of the same lipid species under both LC flow conditions.
Analytical response was next evaluated using the SPLASH Lipidomix dilution series (Figure 4). Integrated peak areas were plotted against the amount loaded on-column for representative PC, SM, and DG standards. Nano flow extended the response to lower on-column loads for all standards evaluated. The lower end of the selected response range was extended to twofold lower on-column load for SM, 10-fold lower for PC, and 40-fold lower for DG compared with high flow. Similar class-dependent improvements in sensitivity and quantitative response have been reported for reduced-flow lipidomics. Danne-Rasche et al. showed that nLC extended the linear dynamic range for most lipid standards evaluated compared with narrow-bore HPLC, whereas more recent work by Girel et al. also demonstrated increased response for lipid standards under reduced-flow conditions [13, 20]. Higher on-column loads were not evaluated with nano flow in the present study, so the upper ends of the response ranges should not be directly compared between the two workflows. Overall, these results showed another advantage of nano flow, allowing for an extension of the analytical response toward lower on-column loads, further supporting its use, especially when sample amount or analyte abundance is limited.
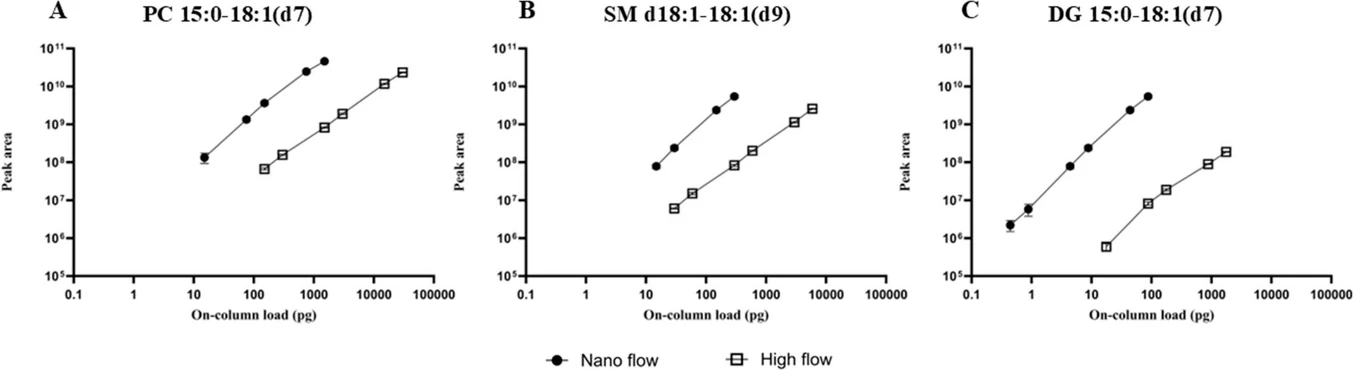 Rapid Commun. Mass Spectrom. 40, no. 23 (2026): e70175: Figure 4: Comparison of nano flow and high flow LC–MS response for representative SPLASH Lipidomix internal standards: (A) PC 15:0–18:1(d7), (B) SM d18:1–18:1(d9), and (C) DG 15:0–18:1(d7). Integrated peak area is plotted against the on-column load (pg) using a log10 scale. Points represent the mean ± SD of three replicate injections. Filled black circles represent nano flow measurements with a 0.1-μL injection, and open black squares represent high flow measurements with a 2.0-μL injection.
The improved performance at lower on-column loads also introduces practical considerations when implementing a nano flow lipidomics workflow. Transitioning a sample preparation developed for high flow to nano flow may require consideration of the sample matrix in addition to injection volume and on-column load.
However, a separate sample preparation workflow may not be required for every sample type. To evaluate this directly, mouse plasma was prepared using isopropanol protein precipitation, and the nano flow injection volume was reduced to 0.01 μL. Pooled plasma QC samples were analyzed over a sequence of approximately 100 injections, with a total of 12 QC injections used to evaluate analytical stability (Figure S2). Across the sequence, representative lipid standards showed consistent retention times and peak area responses, whereas mass errors remained within ±5 ppm. No evidence of emitter failure or clogging was observed. These results show that, under the conditions evaluated, the existing plasma preparation could be used reliably with nano flow by reducing the injection volume. For other sample types, additional sample preparation may still be needed when residual salts or other nonvolatile matrix components are present. These considerations have been discussed in more detail for other miniaturized LC–MS workflows [30, 31].
Wash solvents are also an important consideration when transitioning to nano flow. Lipidomics can be especially demanding with respect to carryover and buildup because strongly retained and poorly soluble material can accumulate in the LC flow path. For the nano flow method used here, a weak wash solvent matching the initial conditions of the gradient and a strong wash consisting of isopropanol/acetone/hexanes (85/10/5, v/v/v) were used to reduce carryover and buildup observed during method development. In addition, a zebra wash consisting of alternating 5% and 100% mobile phase B was included at the end of the gradient before re-equilibration (Figure S1). The zebra wash should also be evaluated for the specific sample type and chromatographic gradient being used, as some optimization of this step may be needed. Column re-equilibration follows the same general chromatographic principles at nano flow and analytical flow rates. For this workflow, five column volumes were used, consistent with published work supporting this as an appropriate equilibration volume under reversed-phase conditions and can serve as a practical starting point when implementing this method [32]. This parameter can be further optimized by the user while monitoring chromatographic reproducibility and method robustness. Taken together, these wash and re-equilibration considerations provide guidance for minimizing carryover and maintaining reproducible chromatography during routine nano flow lipidomics.
4. Conclusion
In conclusion, the nano flow LC–MS workflow provided greater sensitivity and deeper lipid annotation coverage while using less material on-column compared with the established high flow workflow. Nano flow increased high-quality lipid annotations across multiple lipid classes, reduced unintentional fragmentation for the representative lipids evaluated, and extended the analytical response to lower on-column loads while also reducing solvent consumption. Although some of the observed differences may also reflect differences between the complete LC–MS workflows, the overall results demonstrate several advantages of the nano flow workflow compared with the highflow workflow particularly when sample amount or analyte abundance is limited. The analytical stability and practical considerations evaluated here further support the routine implementation of nano flow lipidomics with appropriate attention to sample preparation, loading, washing, and re-equilibration. Overall, nano flow provides a sensitive and complementary approach for untargeted lipidomics.