Mo, 16.11.2026 | Original article from: Environ. Sci. Technol. (2026) 60 (37): 26464–26475
A cross-system study shows that energy content and Gibbs free energy of formation strongly influence microbial degradation and carbon persistence in natural organic matter.Energetic Controls on Biodegradation of Organic Matter from Diverse Environmental Sources
Environ. Sci. Technol. (2026) 60 (37): 26464–26475: Figure 2. Respiratory quotient (RQ) variability across OM sources.
This study investigates how energetic and thermodynamic properties control microbial degradation of organic matter from soils, sediments, and plant material. CO₂ production and O₂ consumption were measured alongside energy content, Gibbs free energy of formation, and other organic matter characteristics to explain variation in decomposition rates and respiratory quotients.
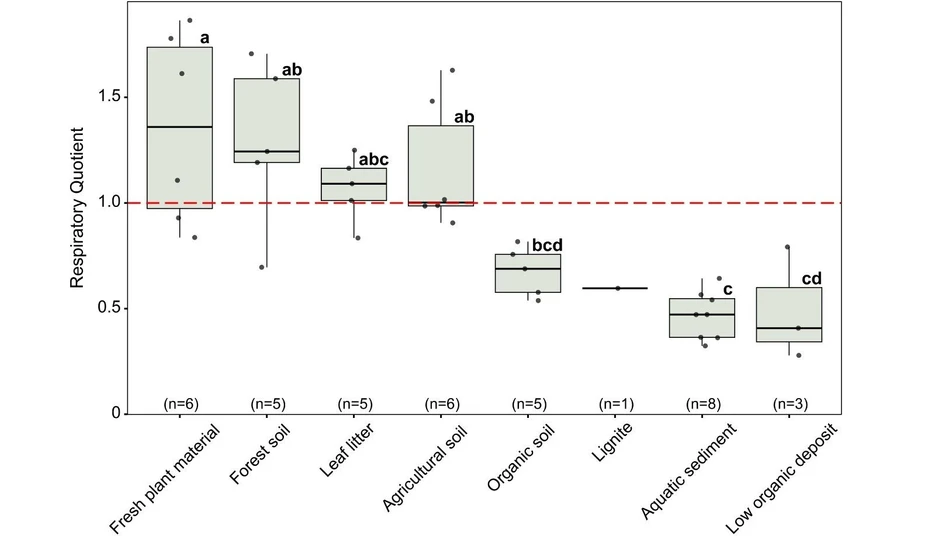
Both intrinsic thermodynamic stability and specific energy content significantly influenced degradation across environmental samples, while mineral interactions provided an additional constraint. Respiratory quotients ranged from 0.34 to 1.36 and tracked differences in substrate utilization and metabolic activity, demonstrating that the energetic signature of organic matter can help explain carbon persistence across ecosystems.
The original article
Energetic Controls on Biodegradation of Organic Matter from Diverse Environmental Sources
Konstantinos-Marios Vaziourakis*; Liam Heffernan; Elizabeth Jakobsson; Dolly Kothawala; Lars Tranvik
Environ. Sci. Technol. (2026) 60 (37): 26464–26475
https://doi.org/10.1021/acs.est.5c18534
licensed under CC-BY 4.0
Selected sections from the article follow. Formats and hyperlinks were adapted from the original.
Organic matter (OM) is a key component of Earth’s ecosystems, regulating biogeochemical processes and elemental cycling. (1) Microbial decomposition determines whether OM persists as a long-term sink or is mineralized into greenhouse gases; (2) thus, understanding the factors that control the rate of microbially derived OM decay is crucial. Several factors have been proposed to control biodegradability in different ecosystems; the soil literature increasingly emphasizes extrinsic environmental controls such as soil heterogeneity and mineral adsorption, (3, 4) whereas freshwater studies highlight intrinsic molecular properties as major constraints on OM degradation. (5−7) These divergent perspectives suggest that the understanding of broader mechanistic controls spanning distinct environmental boundaries is poorly developed. (8)
Decomposition is commonly considered to depend on the molecular composition of OM, including bulk proxies such as the carbon-to-nitrogen ratio (C:N), (9−11) or structural and molecular characterization based on Fourier-transform infrared spectroscopy (FTIR) (12, 13) and solid-state nuclear magnetic resonance spectroscopy (NMR). (14−16) In addition to the solid phase, the properties of dissolved organic matter (DOM) can also be analyzed for its persistence in soils (17) and aquatic environments (5) using bulk optical characteristics (absorbance and fluorescence) of DOM (6, 18, 19) and high-resolution mass spectrometry (20, 21) to describe molecular characteristics. Although all of these methods are helpful for understanding OM chemical composition, they are not straightforward in assessing how energetically and thermodynamically accessible OM is to microbial decomposition. To bridge this gap, it is essential to evaluate the extent to which the energetic and thermodynamic traits of OM are linked to its degradability.
In addition to the energetic constraints of bioavailable OM, the degradative capacity of microbial communities, including their physiological state and capacity to produce the required extracellular enzymes, also influences decomposition, as reflected in their respiratory quotient (RQ), which is primarily regulated by growth stoichiometry. (39−41) The RQ is the molar ratio of carbon dioxide produced to that of oxygen consumed during aerobic respiration. On the basis of the intrinsic properties of OM, highly oxidized substrates tend to result in higher RQ values, whereas more reduced substrates are associated with lower RQ values. (40, 42) Recently, it was suggested that the metabolic capacity of microbial degraders to utilize various carbon substrates controls RQ, and that the intrinsic properties of OM did not substantially affect variation in RQ. (41) However, it remains poorly understood whether variability in RQ captures cross-system patterns in decomposition rates and is influenced by the energetic and thermodynamic properties of OM.
Studies of the mineralization of OM rarely compare across broad ranges of environmental sources. It has been argued that wide cross-system comparisons could provide a unified understanding of OM degradation. (8) Based on this argument, we incubated OM from litter, soil, and sediment from various aquatic and terrestrial environments to explore their aerobic decomposition dynamics. We aim to (a) identify key characteristics of OM, particularly those related to its energy availability (kJ g C–1), controlling its microbial degradability, and (b) test whether a simple model can predict OM degradation rates across a wide range of soils and sediments with different characteristics across different climatic regions. We hypothesized that, despite the vast diagenetic differences and the ambient microbiome of fresh plant material, leaf litter, soils, and aquatic sediments, the energetic properties (specific energy and ΔGf) of OM, relative to other OM descriptors, can control its biodegradability. Therefore, both energetic and thermodynamic traits of OM can represent a universal link between the intrinsic properties of OM and microbial degradation.
Materials and Methods
Determination of the Bulk Chemical and Energetic Properties of Organic Matter
The molar-based concentrations of carbon (C), nitrogen (N), hydrogen (H), and oxygen (O) in the freeze-dried and powdered subsamples of all the materials were measured in triplicate on an elemental (CHN/O) analyzer (Costech 4010 Elemental Combustion System, Cernusco s/Nav., Italy). Elemental analysis was performed for C, H, and N separately from O, which required a separate pyrolysis step. Additional details on the analytical steps, including the analytical standards used for calibration and quality control, are given in Text S4. Subsamples were also acidified with 5% HCl prior to measurement to remove inorganic compounds. From this elemental analysis, the chemical formula of OM (CaHbNcOd), the C:N (carbon to nitrogen) ratio, and the oxidation state of carbon (Cox) were calculated, as described in Text S4. Because elemental oxygen was measured on bulk samples after acidification, the estimated oxygen content may include contributions from both OM and inorganic mineral phases (e.g., oxides and hydroxides). This source of uncertainty is expected to be greatest in 11 samples (i.e., samples from agricultural soils, aquatic sediments, and low-organic deposits) with low organic matter content (<5%) and is evaluated in Text S4. Thus, Cox estimates for these samples should be interpreted with caution, although this does not affect the main conclusions of the study.
To characterize the structural composition and some basic functional groups related to the chemical composition of OM, freeze-dried and powdered samples were analyzed on a high-performance vacuum solid-state Fourier transform infrared (FTIR) spectrometer (VERTEX 80 V, Bruker, Germany). The ground sample (3 mg) was mixed with 297 mg potassium bromide (KBr, for IR spectroscopy, Uvasol®, Merck, USA) in a mortar, pressed into a 13 mm pellet, and measured covering a wavenumber range of 4,000–400 cm–1 with a spectral resolution of 4 cm–1. Anhydrous ethanol was used to clean the sample holder between samples. The OPUS 8.5.29 software (Bruker, Germany) was used to correct the baseline using the rubber-band method, and normalization was performed using the min-max method from the OPUS default option to account for differences in organic matter content. To minimize spectral interferences from minerals, only peaks within the 1,400–3,400 cm–1 range were evaluated, as low-organic deposits exhibited lower absorbance in this window. Peaks outside this range, particularly in regions where Si–O bonds overlap with polysaccharide signals (900–1,100 cm–1), were excluded from the analysis (Figure S9). The peaks used in the current analysis included the aliphatic CH2 stretching, the carbonyl C═O stretching in lipids, the O–H stretching in (hydro)oxides of clay minerals, and the aromatic C═C stretching. (43, 44) The aromaticity index was calculated as the ratio of aromatic to aliphatic groups. (45) The exact wavelengths and the functional group assignment are listed in Table S2.
Determination of the Chemical Properties of Water-Extractable OM
To assess the properties of the water-extractable OM from all the samples, a water extract was prepared by mixing homogenized samples with Milli-Q water in a standard ratio of 1:10. The leachate was filtered through 0.7-μm glass microfiber, pre-combusted filters (GF/F grade, Whatman®, UK) and analyzed for dissolved organic carbon (DOC) and total dissolved nitrogen (TDN) on a TOC/TN analyzer (Shimadzu TOC-L/TNM-L, Kyoto, Japan). UV-Vis absorbance spectra were recorded on filtered samples across a wavelength range of 250 to 600 nm using a Thermo Fisher Scientific UV visible Spectrometer (Thermo Scientific Genesys 50, USA). From these spectra, three optical proxies were derived for the dissolved organic matter (DOM) characterization: the specific UV absorbance at 254 nm (SUVA254) as a proxy for DOM aromaticity, (19) the exponential spectral slope of the log-transformed absorbance spectrum over the wavelength range of 250–465 nm, reflecting DOM molecular weight, (18) and the 250/365 absorbance ratio as a proxy for nonaromatic and low molecular weight compounds. (46) To characterize the chemistry of the water leaching from the soil, sediment, and litter, the pH of the water extracts was measured using a portable pH meter (Hanna HI991300; Woonsocket, Rhode Island, USA). Major anions (chloride, nitrate, phosphate, sulfate, acetate) and cations (sodium, ammonium, potassium, calcium, magnesium) were analyzed in 0.2-μm filtered samples using a Metrohm Ion Chromatography system (883 Basic IC Plus and 919 Autosampler Plus). A detailed description of the extraction and subsequent analyses is given in Text S6.
Results and Discussion
Potential OM Decomposition Rates and Variability in RQ across Environmental Sources
The rates of OM degradation, as measured by both CO2 mineralization and O2 respiration, varied significantly across the studied sources (Kruskal–Wallis test, p < 0.001; Figure 1), with a substantial effect size (η2[H] = 0.68–0.80, depending on the type of normalization). This variability is related to the diagenetic history of the OM, with fresh plant matter and leaf litter degrading most rapidly, followed by soils and sediments, with lignite degrading most slowly. This is consistent with previous studies in both terrestrial (4, 49, 50) and aquatic ecosystems. (51−53)
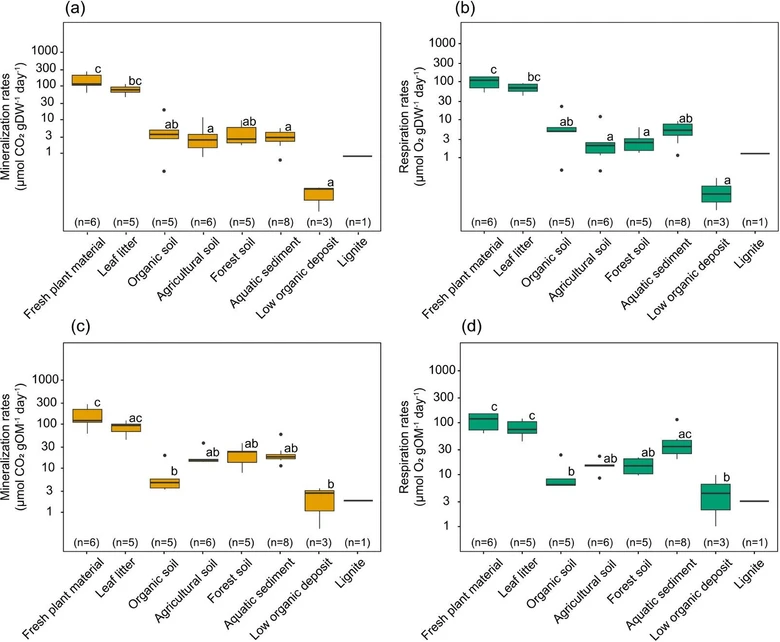 Environ. Sci. Technol. (2026) 60 (37): 26464–26475: Figure 1. Mineralization and respiration rates across different OM sources. Each boxplot displays the median (central line), interquartile range (box), and whiskers extending to 1.5 times the interquartile range. Points represent outliers at each OM source. The upper panels (a, b) represent the mass-specific normalization method (gram of dry weight; gDW), while the lower panels (c, d) represent the organic matter-specific normalization method (gram of organic matter; gOM). The latter is calculated by loss of ignition when the freeze-dried sample is heated to 550 °C. Letters above boxplots indicate statistical groupings based on a post-hoc Dunn’s test following a Kruskal–Wallis analysis, where different letters represent significant differences between ecosystems (p < 0.05). Sample sizes (n) for each source type are indicated above the x-axis.
We found that patterns in decomposition rates depend on whether they are normalized to dry weight (DW) or to the weight of organic matter (OM). When normalized to dry weight (DW; mass-specific rates; Figure 1a, 1b), fresh plant material exhibited the highest mineralization (median ± standard error: 107 ± 32 μmol CO2 g DW–1 day–1) and respiration rates (111 ± 16 μmol O2 g DW–1 day–1), while lignite (0.8 μmol CO2 g DW–1 day–1, 1.3 μmol O2 g DW–1 day–1) and low organic deposits (0.1 ± 0.06 μmol CO2 g DW–1 day–1, 0.2 ± 0.6 μmol O2 g DW–1 day–1) showed the lowest rates. Other types of soils (organic, agricultural, and forest) and aquatic sediments showed intermediate but markedly lower values than fresh plant material and leaf litter. Similarly, when normalized to OM content (OM-specific rates; Figure 1c, 1d), fresh plant material (120 ± 37 μmol CO2 g OM–1 day–1, 121 ± 17 μmol O2 g OM–1 day–1) and leaf litter (94 ± 13 μmol CO2 g OM–1 day–1, 74 ± 14 μmol O2 g OM–1 day–1) maintained the highest degradation rates, followed by forest soils, aquatic sediments, and agricultural soils. However, OM-specific rates were substantially lower than mass-specific rates in organic soils, making them more similar to low organic deposits (3 ± 0.6 μmol CO2 g OM–1 day–1, 7 ± 6 μmol O2 g OM–1 day–1). To further explore the relationship between the two different normalization methods, we tested the correlation between DW and OM content across all samples. We found a negative relationship between DW and OM (R2 = 0.58, p < 0.001, F(1,37) = 51.79; Figure S6), indicating that, while mass-specific and OM-specific decomposition rates generally follow similar trends, notable variation exists, suggesting that other factors beyond OM content may further influence the decomposition dynamics. Mass-specific rates capture the overall microbial activity within the sampled matrix and integrate both intrinsic OM properties and extrinsic controls, while OM-specific rates reflect the vulnerability of the OM stock itself. Thus, due to the wide variability in sample properties, the choice of normalization may affect interpretations, as previously discussed in studies of both soils and freshwater sediments. (54−56) For this reason, both normalization approaches were considered in the PLS analysis to evaluate the influence of OM properties and other extrinsic variables on degradation rates.
Microbial Degrading Performance and RQ Variability across Environmental Sources
To gain insight into microbial degradation performance, we estimated the RQ, defined as the ratio of CO2 production to O2 consumption. We found strong linear correlations between CO2 production and O2 consumption across the different ecosystems (Table S3 and Figure S5) indicating a strong stoichiometric coherence between the two rates. Respiration rates (μmol O2 g DW–1 day–1) were proportional to mineralization rates (μmol CO2 g DW–1 day–1) across the fresh plant material, the fresh litter, and the agricultural and forest soils, but substantially higher than mineralization rates in organic soils, lignite, aquatic sediments, and low-organic deposits, resulting in RQ < 1. These samples represent older OM that has undergone more extensive decomposition than fresh plant material and leaf litter. Overall, RQ differed significantly between the various sources (Kruskal–Wallis test, chi-squared = 27.62, df = 6, p < 0.001; Figure 2) with a large effect size (η2[H] = 0.70), indicating strong differences among environments and that a substantial proportion of the variance in RQ is explained by the environmental sources. The highest RQ was measured in fresh plant material (median ± standard error; 1.4 ± 0.2), followed by forest soils (1.2 ± 0.2), leaf litter (1.1 ± 0.1), and the agricultural soil (1.0 ± 0.1). Organic soils showed intermediate RQ values (0.7 ± 0.10) close to lignite (0.60, while the aquatic sediments and the low-organic deposits had significantly the lowest values (Figure 2) of all samples (0.4 ± 0.1 and 0.3 ± 0.1, respectively).
Environ. Sci. Technol. (2026) 60 (37): 26464–26475: Figure 2. Respiratory quotient (RQ) variability across OM sources. Each boxplot displays the median (central line), interquartile range (box), and whiskers extending to 1.5 times the interquartile range. Points represent individual data values, showing variability within each ecosystem type. Letters signify the results of the post-hoc test (Dunn-test, p values adjusted with the Benjamini-Hochberg method) for the Kruskal–Wallis test and indicate significant differences across the different sources. Sample sizes (n) for each source type are indicated above the x-axis. The dashed red line indicates the assumed value of RQ = 1, which is frequently used in literature.
Toward a Generalized Energetic Framework of OM Degradation across Ecosystems
Considering the most influential factors on degradation across the studied environments, we propose a conceptual framework (Figure 5) of decomposition dynamics. This illustrates that decomposition patterns across OM sources can be simplified into a gradient driven largely by intrinsic energetic properties. OM with more positive ΔGf values and a higher specific energy is associated with a higher aliphatic content and decomposes faster (e.g., fresh plant material and leaf litter). Various soil types and aquatic sediments show intermediate values for these variables and degrade more slowly. At the other end of the spectrum, OM with highly negative ΔGf values and fewer C–H bonds tends to persist. Extrinsic factors, such as mineral associations (e.g., (hydro)oxides content in clays) and microbial carbon metabolism (e.g., RQ), can further modulate this relationship by limiting or enhancing the effect of intrinsic OM properties, underlining the combined role of substrate composition and environmental conditions in controlling OM degradation.
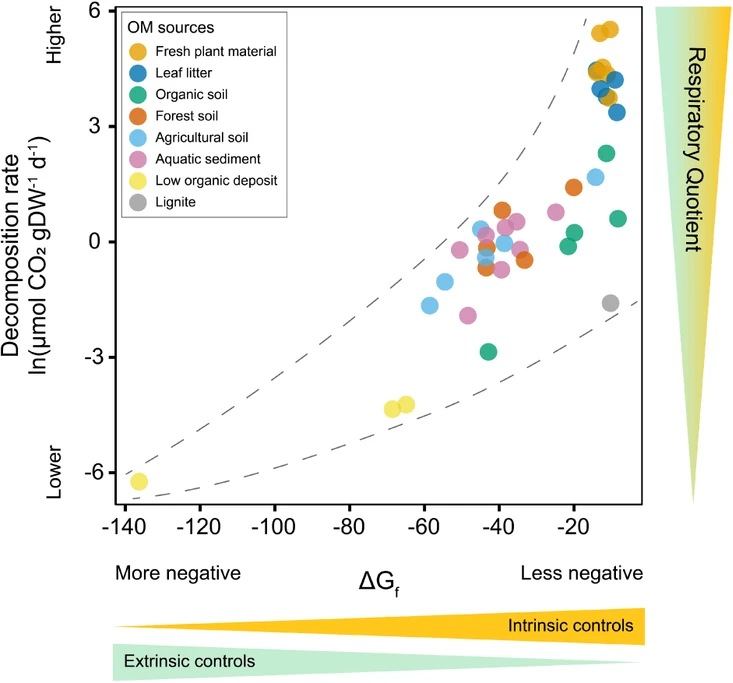 Environ. Sci. Technol. (2026) 60 (37): 26464–26475: Figure 5. Conceptual illustration of controls on organic matter decomposition across the studied OM sources. The top panel illustrates the relationship between decomposition rates (CO2 production rate) and Gibbs free energy of OM formation (ΔGf in kJ g C–1), showing that substrates with less negative ΔGf values are associated with higher decomposition rates, while those with more negative ΔGf values decompose more slowly. Colored points represent different ecosystem types, as indicated in the legend. The bottom panel summarizes the relative contributions of intrinsic and extrinsic factors in controlling decomposition. Intrinsic controls (yellow) include indicators of energy availability and substrate composition, including specific energy and aliphatic content. Extrinsic controls (green) is the (hydro)oxides content in clay minerals. The respiratory quotient (RQ) variability reflects microbial metabolic patterns and follows a similar trend to decomposition rates, which are affected by both intrinsic and extrinsic parameters across the studied environments. The data points in the biplot represent measured values on linear scales. Dashed lines indicate the bounds of the observed data points.
This type of incubation experiment simplifies or excludes natural variability introduced by field conditions (e.g., soil heterogeneity, fluctuating temperature, water availability, redox dynamics, fresh inputs such as root exudates, microbial interactions, and solute transport), in particular, when samples with widely different in situ habitat structures and biotic interactions are compared. However, as exemplified here, they enable mechanistic insights beyond what is possible in the field and may shed light on patterns that are general across environmental sources.
Our study provides evidence that OM decomposition across natural sources is influenced by thermodynamic and energetic constraints, with Gibbs free energy of formation (ΔGf) emerging as a robust predictor of microbial mineralization and respiration rates. This energetic perspective presented here could be used to improve Earth system models. While current models typically rely on empirical decay constants for predefined OM pools, (33, 85) thermodynamic/energetic parameters can offer a more mechanistic and dynamic representation of OM turnover and enable linking of terrestrial and aquatic systems, (86, 87) with a holistic, ecosystem-independent perspective on OM decomposition. Most importantly, since chemical and energetic properties may capture different aspects of OM, incorporating both can provide a more complete view of OM reactivity across environmental sources. (31, 88)