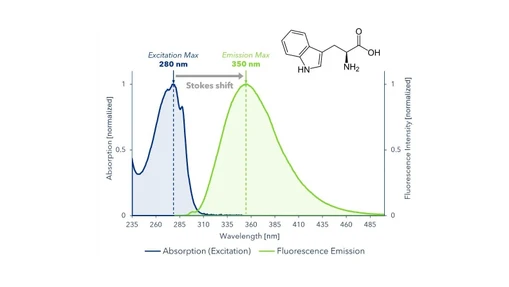
We, 26.8.2026 | Original article from: KNAUER
Explore how UV/VIS detection works in HPLC, compare fixed-, variable-, multi-wavelength and diode array detectors, and learn their key strengths, limitations and applications.Seeing is Believing – Detection Made Easy Part 3: UV/VIS Detectors

KNAUER: Seeing is Believing – Detection Made Easy Part 3: UV/VIS Detectors
When analysts think about detectors used in HPLC, UV/VIS absorption detection is usually one of the first techniques that comes to mind. From pharmaceutical testing and food analysis to environmental monitoring, UV detection is so widely established that it often serves as the first choice when developing a new HPLC method.
There are good reasons for its popularity: UV detectors combine sensitivity with robustness, stability, relatively low cost, and compatibility with almost all standard HPLC workflows, including gradient elution. Whether you are taking your first steps in HPLC or already have extensive experience developing and optimizing complex methods, understanding the principles of UV/VIS detection is essential for achieving efficient analyses and interpreting results reliably.
Let’s take a closer look at this fundamental detection technique used in HPLC!
How UV/VIS Detection Works
UV/VIS detectors used in HPLC are in-line detectors that monitor the absorption of ultraviolet or visible light at one or several wavelengths while analytes pass through a flow cell (Figure 1). The measurement follows the Beer-Lambert law, which describes the relationship between absorbance and concentration: absorbance is directly proportional to the concentration of the compound present in the flow cell.
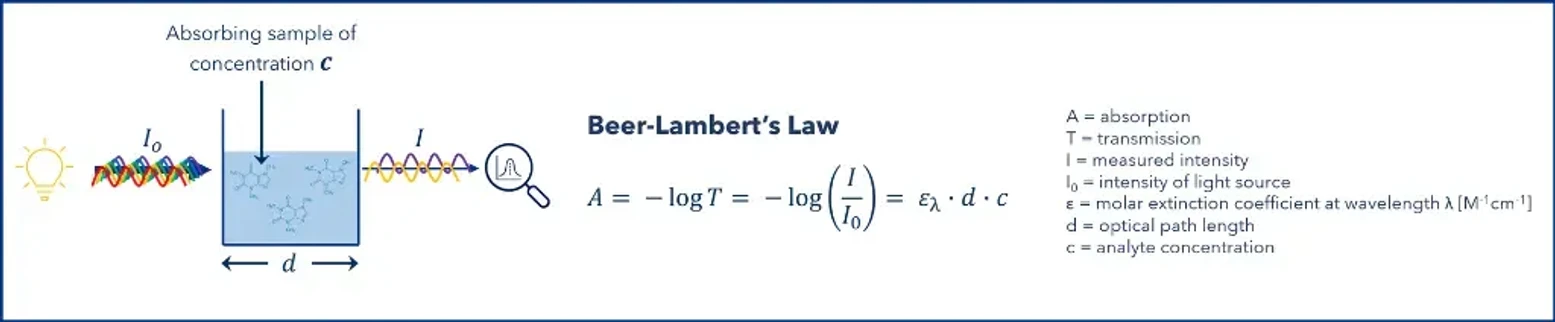 KNAUER: Figure 1: Principle of UV detection and absorbance according to the Beer-Lambert
As individual compounds elute from the HPLC column, substances that absorb at the selected wavelength decrease the amount of light reaching the detector. The detector converts this change in light intensity into a chromatographic signal, which appears as a peak. The resulting signal can then be used to determine the quantity of a compound leaving the HPLC column.
Which Compounds Absorb UV or Visible Light?
Absorption of UV or visible light generally results from electronic transitions involving molecular orbitals in structures such as:
- Aromatic rings
- Conjugated double bonds
- Heterocycles
- Chromophores found in peptides and proteins
Table 1 provides examples of typical UV absorption maxima for different organic chromophoric groups. UV/VIS detectors can operate across a broad wavelength range, for example from approximately 190 to 700 nm, allowing many different classes of compounds to be detected.
This broad applicability is one of the main reasons why UV detection is such a useful tool for both common small-molecule pharmaceuticals and biological analytes.
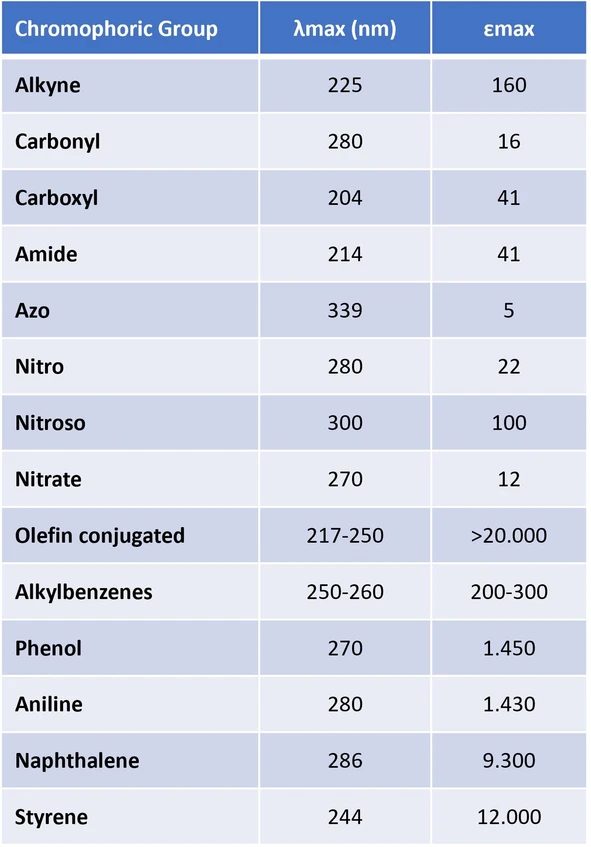 KNAUER: Table 1: Typical UV absorption characteristics of organic functional groups containing chromophores, i.e. light-absorbing structural units.
Types of UV/VIS Detectors
Several types of UV/VIS detectors are used in HPLC. The main categories include fixed-wavelength detectors, variable-wavelength (VWD) or multiple-wavelength (MWD) detectors, and diode array or photodiode array detectors (DAD/PDA). Fixed-wavelength instruments operate with one defined wavelength emitted directly by the light source. Variable-wavelength and diode array detectors instead use broad-spectrum light, allowing the user to select one or several wavelengths for monitoring.
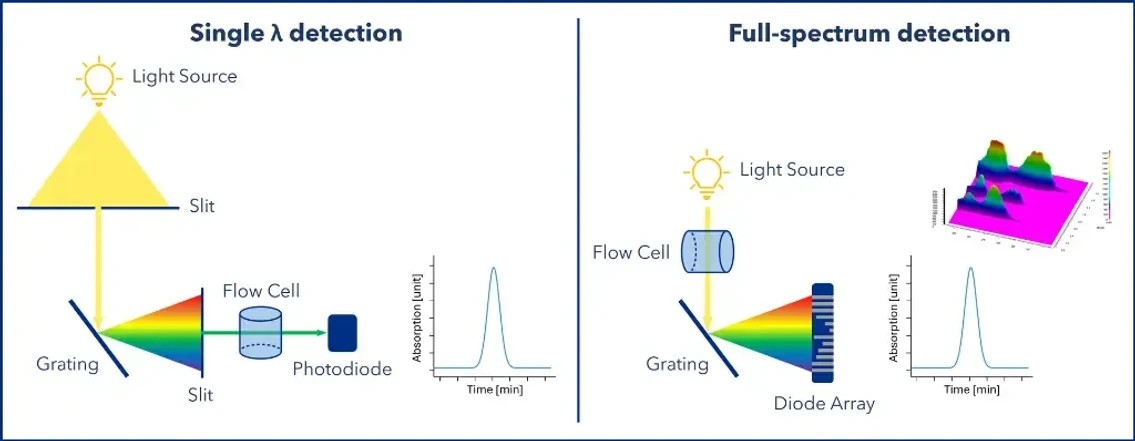 KNAUER: Figure 2: Schematic representation of optical configurations used in UV/VIS detectors. Left: In a conventional UV/VIS detector, a monochromator selects one wavelength that passes through the flow cell before the transmitted light is measured by a photodiode and converted into a signal. Right: In a diode array detector, the complete light spectrum passes through the flow cell and the transmitted light is subsequently dispersed by a fixed grating onto an array of photodiodes.
1. Fixed Wavelength Detectors
Fixed wavelength detectors determine absorbance at only one predefined wavelength. These UV detectors are simple in construction, robust, economical, and capable of providing high sensitivity at the wavelength for which they are designed. Their uncomplicated design makes them particularly common in educational instruments and compact or portable HPLC systems.
Early instruments frequently used low-pressure mercury lamps because they generate a very strong monochromatic emission line at 254 nm. Additional wavelengths, including 280 nm, 265 nm, and 214 nm, could be obtained by introducing phosphor into the source or by using zinc lamps or optical filters. In newer instruments, mercury lamps have increasingly been replaced by LEDs, which offer better stability and longer operating lifetimes. Typical wavelengths used today include 254 or 260 nm and 280 nm.
During measurement, light travels through the flow cell containing the mobile phase and the analyte. A photodiode measures the transmitted light and converts it into an electrical signal. Many detector designs also incorporate a reference cell, allowing the sample signal to be compared against a reference, often air. The resulting difference is then converted into an absorbance value according to the Beer-Lambert law.
Although fixed wavelength detectors provide less flexibility than variable-wavelength or diode array systems, they remain dependable and cost-effective solutions for routine applications in which consistent sensitivity at one particular wavelength is required.
2. Single or Variable Wavelength Detectors (UVD, VWD)
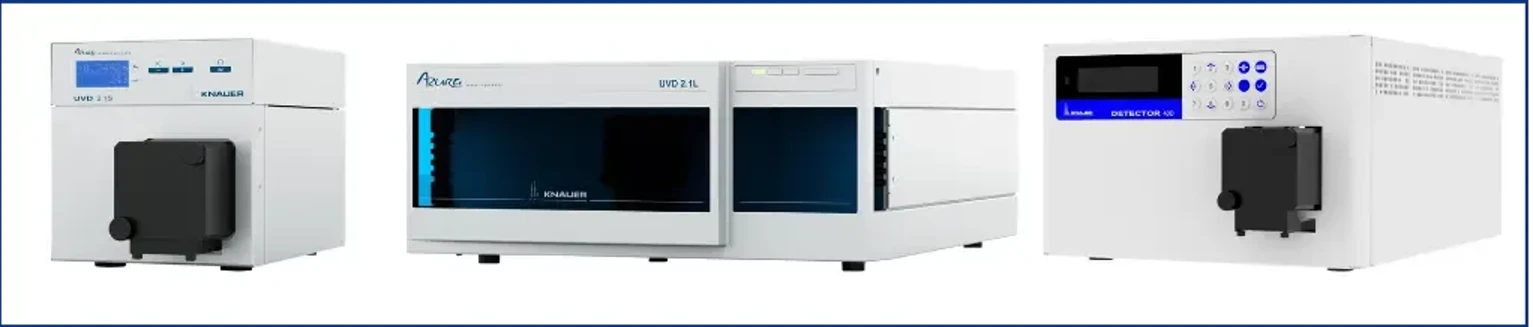 KNAUER: Figure 3: KNAUER single variable wavelength UV/VIS detectors. From left to right: AZURA® UVD 2.1S, AZURA® UVD 2.1L, BlueShadow 40D.
Single or variable wavelength detectors also monitor absorbance at one wavelength at a time. In contrast to fixed wavelength instruments, however, the measurement wavelength can be selected from a broad range, typically between 190 and 700 nm. This versatility has made variable-wavelength detectors a standard choice for many routine HPLC methods.
A broad-spectrum source, most commonly a deuterium lamp, generates continuous UV/VIS radiation. This polychromatic light enters a monochromator consisting of an entrance slit, a rotating diffraction grating, and an exit slit. The motor-driven grating separates the light into its individual wavelengths. Depending on the position of the grating, the required wavelength is directed through the exit slit and then through the flow cell. A photodiode measures the transmitted light and converts the optical energy into an electrical signal (Figure 2, Left).
Many modern instruments use a dual-beam optical configuration. After the light passes through the exit slit, a beam splitter or semi-transparent mirror divides it into a sample beam and a reference beam. Separate photodiodes monitor the intensity of both beams, and these measurements are converted into a quantitative absorbance signal according to the Beer-Lambert law. Only the sample beam travels through the flow cell.
Because the wavelength can be optimized for a specific analyte and can even be changed during the chromatographic run—for example, monitoring one analyte at 220 nm and another at 280 nm—UVDs and VWDs can deliver very good sensitivity and selectivity. They provide an attractive combination of performance, flexibility, and ease of use. They are particularly suitable for compounds that absorb at specific wavelengths or are sensitive to light because the analyte is not exposed to the complete light spectrum during detection.
3. Multi-Wavelength Detectors (MWD)
 KNAUER: Figure 4: KNAUER multi-wavelength UV/VIS detectors. From left to right: AZURA® MWD 2.1L, AZURA® VWD 2.1L, BlueShadow 50D.
Multi-wavelength detectors are capable of monitoring absorbance at several wavelengths at the same time, commonly across a range from approximately 190 to 600 nm and, in some systems, extending to 1000 nm. Instruments capable of recording up to four wavelengths simultaneously are particularly common, enabling more analytical information to be collected during a single chromatographic run.
MWDs are often based on optical designs similar to variable-wavelength detectors and generally use a deuterium lamp for UV/VIS measurements. A tungsten lamp may be included to extend the usable range further into the visible region. Some manufacturers also provide simplified versions of diode array detectors marketed as MWDs, offering a lower-cost alternative without full spectral scanning and three-dimensional data capabilities.
Positioned between UVD/VWD and DAD technology, multi-wavelength detectors provide an economically attractive solution for measurements performed near the UV absorbance maxima of analytes while also allowing wavelength switching. They are especially useful for compounds containing multiple chromophores, as is the case for many pharmaceutical substances.
4. Diode Array / Photodiode Array Detectors (DAD/PDA)
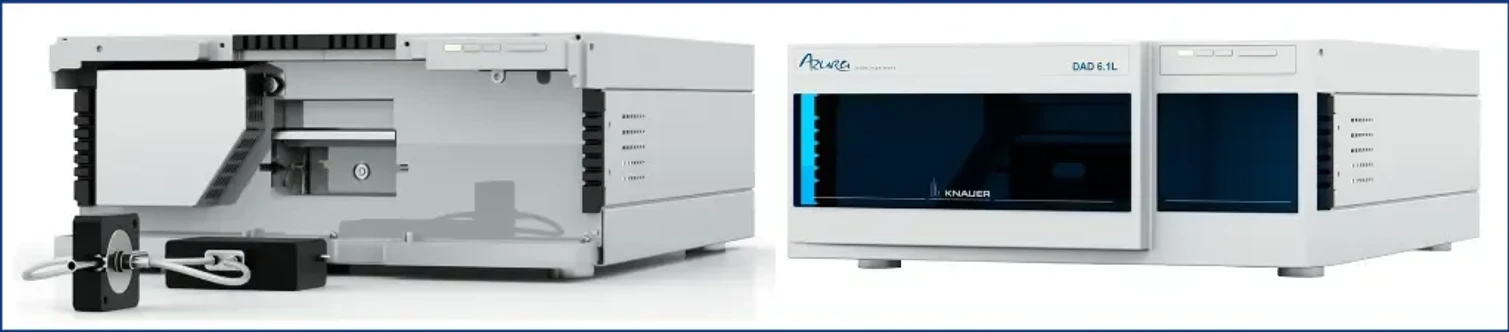 KNAUER: Figure 5: KNAUER diode array UV/VIS detectors. From left to right: AZURA® DAD 2.1L, AZURA® DAD 6.1L.
Diode Array Detectors (DAD), also called Photodiode Array Detectors (PDA), can simultaneously record the complete UV/VIS spectrum of a sample, typically over a wavelength range from approximately 190 to 1000 nm. Unlike single- or multi-wavelength detectors, which follow only selected wavelengths, a DAD/PDA collects absorbance information over the full spectrum for each chromatographic peak. As a result, both quantitative and spectral information can be obtained during the same analysis.
In a DAD/PDA detector, the complete light output from deuterium and tungsten lamps first passes directly through the flow cell. The transmitted light is then separated by a diffraction grating and projected onto an array of photodiodes, commonly containing 256, 512, or 1024 individual diodes. Each diode measures the intensity of light corresponding to a particular wavelength at the same time. This produces a three-dimensional dataset consisting of absorbance, retention time, and wavelength information (Figure 2, Right).
This functionality makes several advanced analytical tasks possible:
- Compound identification by comparing recorded UV/VIS spectra with reference spectra or spectral libraries.
- Peak purity assessment by comparing absorbance profiles at different positions across a chromatographic peak and identifying potentially co-eluting compounds or impurities with different UV/VIS spectral characteristics.
- Retrospective wavelength selection without repeating the analysis. If the sample was initially measured using full-spectrum acquisition, the data can later be reprocessed at alternative detection wavelengths.
- Comprehensive method development, particularly when working with complex samples or compounds whose characteristics are not yet fully known.
Naturally, a DAD can also be configured to record data only at one or several selected wavelengths rather than acquiring the entire spectrum.
Because DAD/PDA detectors combine multi-wavelength quantification with full spectral acquisition, they have become widely established in modern pharmaceutical, analytical, and research laboratories. Their combination of sensitivity, flexibility, and information-rich data makes them particularly valuable for method development and for the analysis of complex mixtures or samples with unknown composition.
In summary, the greater flexibility of a DAD in terms of wavelength selection and its ability to provide additional information about the analyzed sample explain why it is often the preferred detector in many laboratories. For straightforward routine analyses, however, the additional sensitivity offered by a simpler variable wavelength detector may be more advantageous.
Key Performance Characteristics of UV/VIS Detectors
UV detectors owe much of their popularity to the favorable combination of sensitivity, stability, and cost. Important performance characteristics typically include the following:
Sensitivity
Typical detection limits fall within the ng to µg range, although the actual performance depends on both the analyte and the detector/system configuration.
Linearity
A major advantage of UV detection is its broad linear dynamic range, which frequently covers 4-5 orders of magnitude. This makes quantitative analysis relatively straightforward and reliable across a wide concentration range.
Noise and Drift
Low detector noise and stable baselines contribute to reliable quantitative measurements, particularly when gradient elution is used.
Flow Cell Design
Typical flow cells are manufactured from materials such as stainless steel or fused silica and have optical path lengths of up to approximately 50 mm, with internal volumes commonly ranging from 2 to 10 μL. Low dead-volume designs help reduce unwanted band broadening.
Specialized flow cells are also available for micro-scale, semi-preparative, and preparative chromatography, as well as for many other specific applications. Biocompatible versions can also be used where required. Discover KNAUER’s complete selection of flow cells here.
Advantages & Limitations of UV/VIS Detection in HPLC
UV/VIS detectors are among the most commonly used detection systems in HPLC because they combine uncomplicated operation with reliability and strong performance for a wide variety of analytes. Most small-molecule pharmaceutical compounds, active pharmaceutical ingredients (APIs), and many naturally occurring substances absorb UV radiation. Consequently, UV/VIS detection is frequently the standard option in analytical and quality control laboratories for routine testing, regulated pharmaceutical analysis, and method validation.
Key Advantages
- Straightforward and comparatively inexpensive instrumentation
- High reliability and simple operation with relatively little maintenance
- Excellent quantitative accuracy and precision (< 0.2% RSD) combined with a broad linear range (> 10⁵)
- High sensitivity for compounds showing strong UV absorption and high molar absorptivity ε
- Compatibility with gradient elution and commonly used HPLC solvents
- Relatively low sensitivity to changes in mobile-phase flow rate, refractive index, or temperature
- Nondestructive measurement, making subsequent analysis of the sample possible when required
- Good suitability for automated workflows, with many instruments providing integrated diagnostics and wavelength calibration
Limitations
Despite the many benefits, UV/VIS detection also has several important limitations:
- A chromophore is required—compounds lacking UV-absorbing functional groups cannot be detected efficiently
- Selectivity is lower than with techniques such as fluorescence detection or mass spectrometry because structurally related compounds with unchanged chromophoric groups may produce very similar UV/VIS spectra
- Detector response differs between individual compounds according to their molar absorptivity ε
- The UV cutoff of the solvent can restrict the choice of mobile phase and influence method development, particularly at low detection wavelengths
- Sensitivity may decrease when operating at very high or very low wavelengths
For most applications, these disadvantages can be managed during method development. For compounds without suitable chromophores, however, more universal detection approaches such as refractive index detection (RID), evaporative light scattering detection (ELSD), or charged aerosol detection (CAD) may represent better alternatives.
Side Note: Mobile Phase Considerations and UV Cutoffs
Solvents and mobile-phase additives can themselves absorb UV radiation. Therefore, when UV/VIS detection is used in HPLC, the mobile phase needs to be sufficiently transparent at the selected wavelength to provide stable and reliable measurements.
A solvent’s UV cutoff is defined as the wavelength at which its absorbance reaches 1 absorbance unit (AU). Measuring at or below the UV cutoff can produce excessive background absorbance, increased detector noise, and unstable baselines, all of which reduce sensitivity. For this reason, the selected detection wavelength should generally be higher than the UV cutoff of the solvent. Table 2 lists approximate UV cutoff values for several solvents and additives commonly used in HPLC.
It is also important to remember that buffer constituents and acidic modifiers can absorb strongly at wavelengths below approximately 220-230 nm, further restricting the use of very low detection wavelengths. Choosing sufficiently UV-transparent solvents and additives is therefore an important consideration during HPLC method development and helps minimize baseline drift and excessive noise.
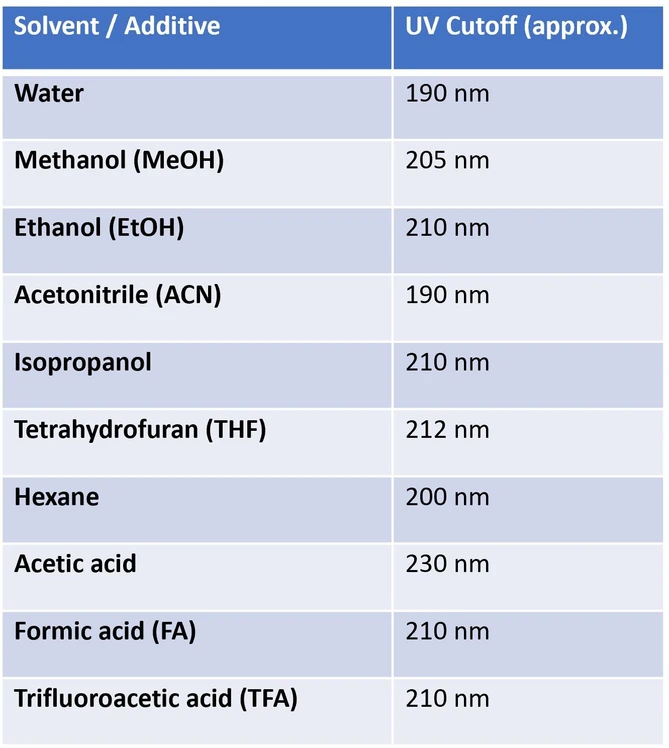 KNAUER: Table 2: Approximate UV cutoff values of common solvents and additives used in HPLC.
When UV/VIS Detection Works Well — and When It Doesn’t
UV/VIS detection performs particularly well for compounds that show strong absorption in the UV region, approximately 190-400 nm, and remain stable in solution. It is especially effective when analytes are present at moderate concentrations and contain chromophores such as aromatic rings or conjugated double bonds.
Common UV-active compounds include:
- Pharmaceuticals and APIs
- Aromatic compounds
- Amino acids, peptides, and proteins, commonly monitored at 214, 220, or 280 nm
- Pesticides
- Food additives and dyes
- Natural products, including flavonoids and phenolic compounds
A large number of compounds also exhibit some absorption below 220 nm as a result of σ → σ* transitions. At these low wavelengths, however, absorption by the solvent becomes an increasingly important consideration.
When UV Detection Is Not Ideal
UV detection is less effective for compounds that do not contain suitable chromophores, including:
- Sugars
- Triglycerides and many other lipids
- Small organic acids
- Certain polymers or inorganic ions
Such analytes absorb little or no ultraviolet light and therefore generate only weak detector responses. UV detection may also become challenging when analytes are present at extremely low concentrations, when samples contain complex matrices, or when several compounds with similar spectra co-elute.
Under these conditions, alternative detection methods such as ELSD, CAD, RID, FLD, or mass spectrometry (MS) may provide better results. These detector types will be discussed in more detail in future articles in our “Seeing is Believing - Detection Made Easy” blog series.
Typical Applications
 KNAUER / AI: Figure 6: Applications of UV Detection in HPLC.
Thanks to the characteristics described above, UV/VIS detection is employed across numerous application areas. In pharmaceutical analysis, it contributes to quality assurance through assay testing, impurity determination, dose uniformity measurements, and stability studies. In environmental monitoring, it can be used to determine aromatic contaminants and pesticides in water and soil. In food and beverage analysis, typical examples include the quantification of colorants and phenolic compounds in products such as wine and tea.
At KNAUER, UV/VIS detectors are applied in numerous practical workflows that demonstrate their versatility across different industries. For example, UV/VIS detection can be used for profiling important organic compounds in wine and grape juice for quality comparison. It also contributes to oligonucleotide quality control in combination with MS for impurity profiling and mass confirmation and enables the characterization of cannabinoids in CBD aroma oils to verify compliance with regulatory requirements such as THC limits.
UV/VIS detection is also incorporated into advanced cannabinoid purification processes such as CBG isolation, as well as into method optimization workflows, for example to improve baseline stability when using TFA-containing mobile phases.
Final Thoughts
UV/VIS detection remains a cornerstone of modern HPLC because it provides an effective balance of sensitivity, simplicity, robustness, and cost efficiency.
Although it is not a truly universal detection technique, it performs very well for the majority of UV-active analytes encountered in pharmaceutical, environmental, food, and research laboratories. DAD/PDA technology further extends the capabilities of UV/VIS detection by adding substantial spectral information and analytical flexibility without dramatically increasing the complexity of the measurement.
This version of the article was adapted from the original text using AI-assisted rewriting and editorial review.
Resources
- L. R. Snyder, J. J. Kirkland, J. W. Dolan, Introduction to Modern Liquid Chromatography, 3rd Edition, John Wiley & Sons, Inc., Hoboken, New Jersey, 2010.
- D. A. Skoog, F. J. Holler, S. R. Crouch, Principles of Instrumental Analysis, 7th Edition, Cengage Learning, Boston, 2018.
- R. P. W. Scott, Liquid Chromatography Detectors. In J. Chromatogr. Library, Vol. 11, Elsevier Scientific Publishing Company, Amsterdam, 1977, pp. iii-ix, 1-248.
- V. R. Meyer, Praxis der Hochleistungs-Flüssigchromatographie, 10., vollst. überarb. u. erw. Auflage, Wiley-VCH, Weinheim, 2009.
- G. Aced, H. J. Möckel, Liquidchromatographie, Apparative, theoretische und methodische Grundlagen der HPLC, VCH Verlagsgesellschaft mbH, Weinheim, 1991.
- M.W. Dong, J. Wysocki, Ultraviolet detectors: Perspectives, Principles, and Practices, LCGC North Amer., 2019, 37(10), 750-759.
- M. W. Dong, HPLC and UHPLC for Practicing Scientists, 2nd Edition, John Wiley & Sons, Inc., Hoboken, New Jersey, 2019.