We, 9.9.2026 | Original article from: KNAUER
Discover how fluorescence detection works in HPLC, why it offers exceptional sensitivity and selectivity, and how to optimize FLD for trace analysis in complex samples.Seeing is Believing – Detection Made Easy Part 5: Fluorescence Detectors
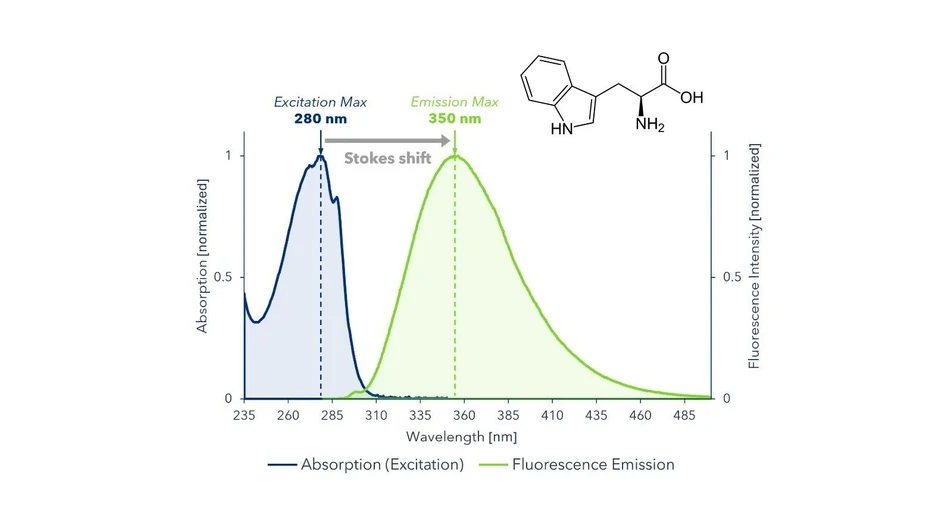
KNAUER: Figure 3: Absorption and emission spectra of tryptophan
Fluorescence Detection in HPLC: Bringing Trace Analytes into the Light
When it comes to High-Performance Liquid Chromatography (HPLC), the detector is what turns a separation into useful analytical information. Among the various detection technologies available, fluorescence detection stands out for its remarkable sensitivity and selectivity, particularly when analytes are present at very low concentrations.
Fluorescence detectors (FLDs) operate by measuring the light emitted by molecules after excitation at a specific wavelength. Instead of monitoring how much incoming light is absorbed, as UV/VIS detectors do, FLDs detect the light generated by fluorescent compounds themselves.
In this article, we will look at the basic principles of fluorescence, the construction and operation of HPLC fluorescence detectors, their advantages and limitations, and some practical considerations for achieving reliable results.
Why Use Fluorescence Detection?
A simple analogy is someone wearing fluorescent clothing under ultraviolet light: against a dark background, the fluorescent object immediately stands out.
 KNAUER / pexels: Figure 1 - Fluorescent jellyfish in a dark aquatic environment
The same principle makes fluorescence detection so attractive in HPLC.
UV and diode-array detectors measure a decrease in transmitted light caused by absorption. An FLD, in contrast, records the light emitted by an analyte after it has absorbed energy at an appropriate excitation wavelength.
Because only selected compounds generate fluorescence under the chosen conditions, the detector can provide a very clean analytical signal with low background interference. This combination results in excellent selectivity and very high sensitivity, especially in complex matrices.
Naturally fluorescent compounds—or compounds that have been chemically modified with a fluorescent label—can often be measured at extremely low concentrations, in some cases down to the picogram level. Depending on the analyte and conditions, fluorescence detection can be approximately 10 to 1,000 times more sensitive than UV detection.
This makes FLD particularly useful in applications such as pharmaceutical analysis, food safety, environmental monitoring, and the analysis of biological samples.
There is, however, an important limitation: only compounds capable of fluorescence can be measured directly. For this reason, FLD is not as universally applicable as UV/VIS detection.
Understanding Fluorescence
Fluorescence is a photophysical process involving the absorption and subsequent emission of light.
When a molecule containing suitable structural groups known as fluorophores absorbs light at an appropriate wavelength, electrons are promoted to a higher-energy excited state. Some of this energy is then lost through vibrational relaxation. As the electrons return to the ground state, the remaining energy is released as emitted light.
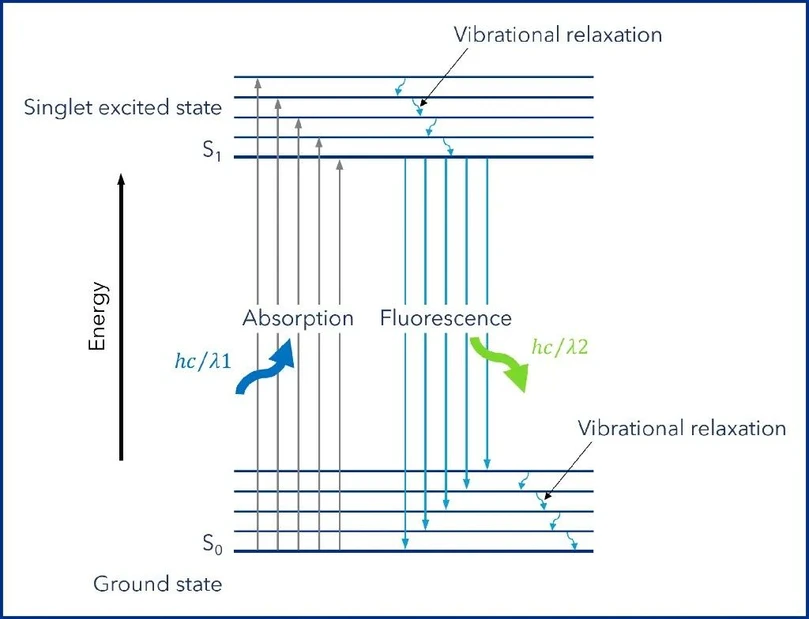 KNAUER: Figure 2: Jablonski diagram. (1) Excitation: The molecule absorbs light at a specific wavelength, promoting its electrons to a higher energy state. (2) Relaxation: Some energy is lost through vibrational relaxation. (3) Emission: As the electrons return to the ground state, light is emitted at a longer wavelength and therefore lower energy.
For example, a compound may absorb excitation light at 280 nm and subsequently emit fluorescence at approximately 340 nm.
The emitted light generally has a longer wavelength than the excitation light because some of the absorbed energy has already been dissipated before emission. The difference between excitation and emission wavelengths is known as the Stokes shift.
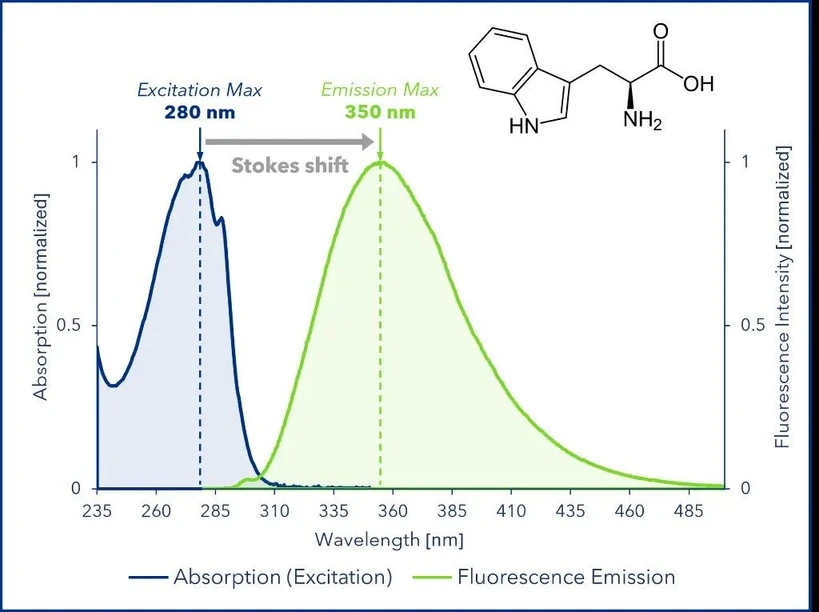 KNAUER: Figure 3: Absorption and emission spectra of tryptophan.
Which Compounds Fluoresce Naturally?
Fluorescence is not a property shared equally by all molecules. It is particularly common among compounds containing aromatic structures and extended conjugated systems.
Examples of naturally fluorescent compounds include:
- fluorescent dyes and markers such as fluorescein and rhodamine
- aromatic amino acids including tryptophan, tyrosine, and phenylalanine
- polycyclic aromatic hydrocarbons (PAHs), for example naphthalene and anthracene
- selected vitamins, including riboflavin and derivatives of vitamin A
For these compounds, fluorescence detection can be used directly without additional chemical modification.
But many analytically important molecules do not fluoresce naturally. In those cases, derivatization can make fluorescence detection possible.
Derivatization: Making Non-Fluorescent Analytes Detectable
Derivatization introduces a fluorescent group into a molecule that would otherwise generate little or no fluorescence signal.
Reagents such as dansyl chloride, fluorescamine, OPA, and FMOC are commonly used to label analytes including amino acids, peptides, carbohydrates, vitamins, and certain pharmaceutical compounds.
 KNAUER: Figure 4: Fluorescent tags used for derivatization in HPLC fluorescence detection.
Two principal approaches are used:
- Pre-column derivatization: The analyte is labelled before injection and chromatographic separation. The approach is relatively straightforward and flexible and can provide high sensitivity. However, reaction efficiency can be affected by the sample matrix, and additional sample-preparation steps are required.
- Post-column derivatization: Analytes are first separated chromatographically and then react with the fluorescent reagent before reaching the detector. This can reduce matrix-related effects and improve robustness, but it requires additional system components, typically consumes more reagent, and depends on sufficiently rapid reaction chemistry.
An ideal derivatization procedure should be fast, reproducible, efficient, and preferably proceed at room temperature with near-complete conversion.
Nevertheless, every derivatization step adds complexity. The analyst must therefore balance the gain in sensitivity against additional sample handling and potential sources of variability.
Inside an HPLC Fluorescence Detector
At first glance, an FLD shares some similarities with a conventional UV/VIS detector, but its optical arrangement is different.
A xenon flash lamp or continuous xenon lamp is commonly used as the excitation source because it provides strong output across the UV region where many fluorescent compounds absorb.
The optical system typically incorporates two wavelength-selection elements, such as monochromators or diffraction gratings:
- one selects the excitation wavelength
- the other selects the emission wavelength
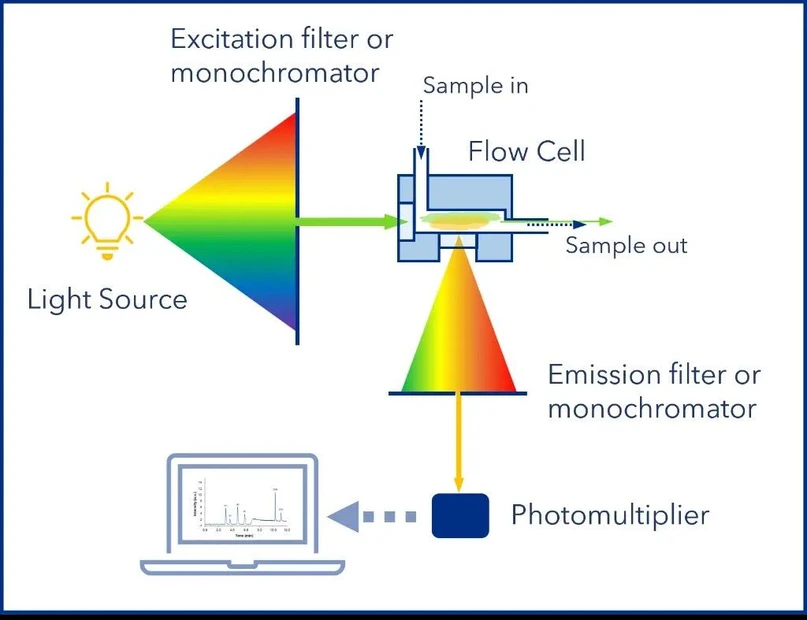 KNAUER: Figure 5: Schematic of a fluorescence detector.
As chromatographically separated analytes pass through the flow cell, fluorescent compounds absorb the excitation light and subsequently emit light at a longer wavelength.
Unlike a UV/VIS detector, which measures light transmitted through the flow cell, an FLD generally collects fluorescence at a 90° angle to the excitation beam. This geometry reduces the amount of excitation and scattered light reaching the detector, helping to lower background interference.
The emitted light is then measured using a highly sensitive photomultiplier tube (PMT) and converted into an electrical signal for chromatographic data acquisition.
Why Choose Fluorescence Detection in HPLC?
High Selectivity and Exceptional Sensitivity
The ability to independently select excitation and emission wavelengths is one of the major strengths of fluorescence detection.
By defining both wavelength settings, the analyst can effectively determine which fluorescent compounds produce a detectable response. Components that do not fluoresce under those conditions contribute little or no signal, reducing matrix interference and background noise.
This provides FLD with excellent selectivity, particularly in complex samples.
At the same time, fluorescence signals can be extremely intense relative to the background. Detection can reach the ng to pg range, and the source reports detection limits approximately 100–1,000 times lower than those typically achieved with UV detection for suitable compounds.
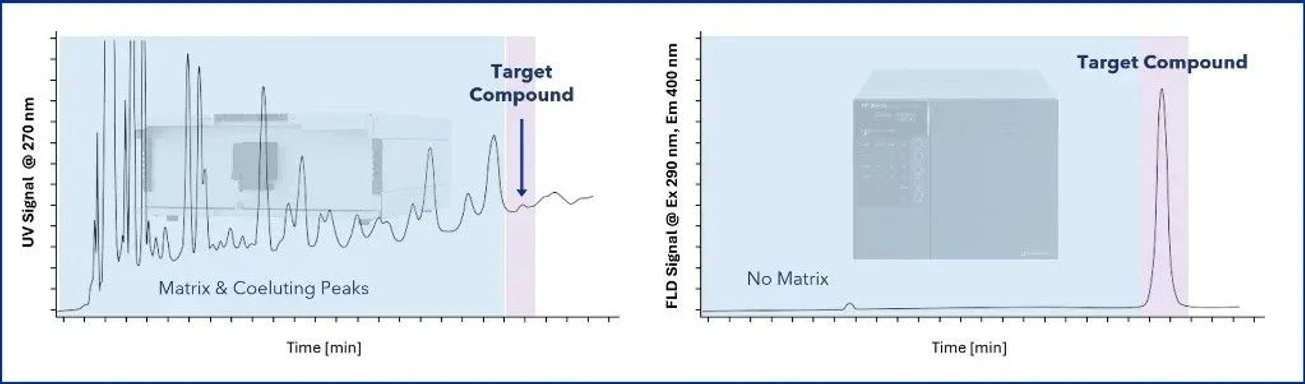 KNAUER: Figure 6: Comparison of UV and fluorescence detection. With UVD (left), the target compound produces only a weak signal among matrix and co-eluting peaks. FLD (right) provides a much more selective and sensitive response for the target compound.
Fluorescence detection can be used with both isocratic and gradient methods and typically provides a dynamic range of approximately 3–4 orders of magnitude, supporting quantitative analysis.
Limitations of Fluorescence Detection
The same selectivity that makes FLD attractive also creates its principal limitation: not every compound fluoresces.
For non-fluorescent analytes, derivatization may therefore be necessary. This introduces extra workflow steps and can become another source of analytical variability.
Method development can also require more optimization than UV detection because both the excitation and emission wavelengths must be selected carefully.
Another important consideration is fluorescence quenching. Signal intensity may decrease because of the solvent, pH, ions, or other conditions surrounding the analyte.
Quenching can also be concentration dependent. At high analyte concentrations, molecular interactions and collisions may reduce fluorescence efficiency, causing the signal to plateau or even decrease. Fluorescence detection therefore does not remain perfectly linear across all possible concentration ranges and generally provides a narrower linear range than UV detection.
Temperature can also influence fluorescence. Increasing temperature typically increases molecular collisions and can reduce the intensity of the emitted signal.
In addition, standard fluorescence flow cells are generally less pressure resistant than those used in UV detectors. The source lists a typical pressure limit of approximately 20 bar for a standard FLD flow cell.
Practical Tips for Better Fluorescence Detection
FLD can provide excellent performance, but it is sensitive to several experimental conditions. Careful method setup can make a major difference in signal intensity and reproducibility.
Optimize Excitation and Emission Wavelengths
Correct wavelength selection is fundamental to maximizing signal while keeping noise low.
Published excitation and emission maxima are useful starting points, but wavelength scans can help determine better settings during method development—particularly when the spectral characteristics of the sample are not yet known.
Multi-wavelength scanning and time-programmed detection can also be used to switch between different excitation/emission pairs during a chromatographic run, supporting the analysis of multiple fluorescent compounds.
Pay Attention to the Mobile Phase
Mobile-phase composition can strongly affect fluorescence.
Some solvents, such as methanol, may quench fluorescence, while others, including acetonitrile, are generally more compatible with fluorescence measurements.
Impurities and additives may also contribute to background fluorescence, making high-purity solvents important.
Dissolved oxygen can act as another quencher. The source therefore recommends continuous degassing with an in-line vacuum degasser and initial vacuum filtration and sonication of aqueous/organic mobile phases to remove larger amounts of dissolved air.
Monitor Quenching Effects
High analyte concentrations, changes in pH, elevated temperature, or particular solvents may all reduce fluorescence intensity.
Where possible, temperature control of the flow cell can help maintain more stable detection conditions.
Keep the System Clean
Contaminants may fluoresce too.
Clean glassware, pure reagents, and careful sample handling are therefore important for minimizing unwanted background signals.
Optimize Slit Widths and Optical Components
Increasing slit width can improve signal intensity, but may simultaneously increase noise.
Detector optics should remain clean and correctly aligned, including the lamp position. Lamp condition should also be monitored, as ageing of the light source can reduce excitation efficiency.
Control Derivatization Carefully
When derivatization is part of the method, reaction conditions need to be reproducible.
Reaction efficiency should be verified, particularly when accurate quantification is required.
Where Fluorescence Detection Is Most Useful
Fluorescence detection is particularly valuable when both high sensitivity and high selectivity are required.
Its ability to selectively monitor fluorescent analytes makes it especially effective for trace analysis and for samples containing complex matrices.
 KNAUER / OpenAI: Figure 7: Common applications of fluorescence detection in HPLC.
Typical application areas include:
- Pharmaceutical analysis – determination of trace impurities, metabolites, and low-dose active compounds in applications such as impurity profiling and stability studies.
- Environmental analysis – monitoring pollutants such as PAHs or pesticides in water and soil. One example is KNAUER’s online SPE-HPLC analysis of PAHs in water with FLD.
- Food and beverage analysis – determination of vitamins, antioxidants, and contaminants such as aflatoxins. KNAUER applications include aflatoxin analysis in cereal-based baby food, dried fruit, pistachios, peanuts, and cannabis products.
- FLD has also been used in GPC-LC to identify and quantify PAHs in olive-oil samples.
- Biochemistry and clinical research – analysis of amino acids, proteins, biomarkers, serum, and plasma, often following derivatization. KNAUER has also demonstrated the analysis of fluorescence-labelled proteins using semi-preparative FPLC and FLD.
- Natural-product analysis – determination of compounds such as alkaloids and flavonoids in plant extracts.
Fluorescence detection can also be installed in series with another detector. For example, UV detection may first provide a broader sample profile, followed by FLD for more selective confirmation or improved detection limits.
Final Thoughts: When Fluorescence Makes the Difference
Fluorescence detection provides an unusual combination of very high sensitivity and strong selectivity, making it especially useful for trace-level measurements and challenging sample matrices.
It cannot match the broad applicability of UV detection because only fluorescent compounds—or analytes that can be derivatized—generate a useful response. When those conditions are met, however, FLD can provide exceptionally clean chromatograms and very low detection limits.
Method development requires careful control of wavelengths, mobile-phase composition, temperature, optical conditions, and possible quenching effects. If derivatization is needed, reaction reproducibility adds another consideration.
For suitable analytes, that additional effort can pay off through lower detection limits, reduced background interference, and greater confidence in the resulting chromatographic data.
This version of the article was adapted from the original text using AI-assisted rewriting and editorial review.
Resources
- M. W. Dong, HPLC and UHPLC for Practicing Scientists, 2nd Edition, John Wiley & Sons, Inc., Hoboken, New Jersey, 2019.
- D. A. Skoog, F. J. Holler, S. R. Crouch, Principles of Instrumental Analysis, 7th Edition, Cengage Learning, Boston, 2018.
- L. R. Snyder, J. J. Kirkland, J. W. Dolan, Introduction to Modern Liquid Chromatography, 3rd Edition, John Wiley & Sons, Inc., Hoboken, New Jersey, 2010.
- Shimadzu Corporation, Basics of Liquid Chromatography, Fluorescence Detection, https://www.shimadzu.com/an/service-support/technical-support/analysis-basics/basic/fluorescence_detection.html (last accessed: 2026-04-13, 12:25)
- J. W. Dolan, How Does It Work? Part V: Fluorescence Detectors, LCGC North Amer., 2016, 34(5), 324-329.
- R. P. W. Scott, Liquid Chromatography Detectors. In J. Chromatogr. Library, Vol. 11, Elsevier Scientific Publishing Company, Amsterdam, 1977, pp. iii-ix, 1-248.
- V. R. Meyer, Praxis der Hochleistungs-Flüssigchromatographie, 10., vollst. überarb. u. erw. Auflage, Wiley-VCH, Weinheim, 2009.
- G. Aced, H. J. Möckel, Liquidchromatographie, Apparative, theoretische und methodische Grundlagen der HPLC, VCH Verlagsgesellschaft mbH, Weinheim, 1991.