Mo, 14.9.2026 | Original article from: Analytica Chimica Acta, Volume 1413, 2026, 345642
A systematic UHPLC-MS/MS study shows that matrix-effect estimates based only on calibration slopes can be biased and introduces an intercept-based correction.Comprehensive investigation of matrix effect evaluation approaches for reliable quantification in bioanalysis using UHPLC-MS/MS
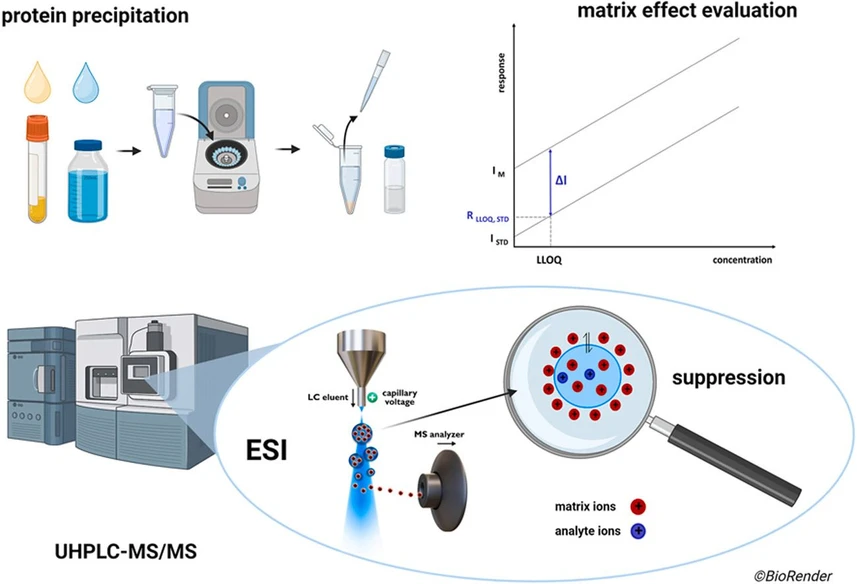
Analytica Chimica Acta, Volume 1413, 2026, 345642: Graphical abstract
This study systematically compares two approaches for evaluating matrix effects in quantitative ESI-UHPLC-MS/MS bioanalysis: post-extraction addition and calibration curve slope comparison. Using 26 compounds in serum and multiple calibration models, the authors found that slope-based evaluation can underestimate matrix effects because it does not account for concentration-independent translational effects reflected in the calibration intercept.
A new intercept-based equation was therefore introduced and validated across different matrices and instrumental platforms. Combining slope- and intercept-derived contributions produced total matrix-effect estimates that closely matched the reference post-extraction addition approach, offering a more reliable strategy for quantitative bioanalytical method validation.
The original article
Comprehensive investigation of matrix effect evaluation approaches for reliable quantification in bioanalysis using UHPLC-MS/MS
Hana Kočová Vlčková, Kateřina Plachká, František Švec, Lucie Nováková
Analytica Chimica Acta, Volume 1413, 2026, 345642
licensed under CC-BY 4.0
Selected sections from the article follow. Formats and hyperlinks were adapted from the original.
In mass spectrometry, the term matrix effect has a narrower definition, referring specifically to changes in ionization efficiency and resulting deviation in analytical response [[8], [9], [10]]. The ME typically manifests as a signal enhancement or suppression [11,12], thereby severely compromising key parameters of quantitative analysis, including linearity, accuracy, precision, and sensitivity. This effect arises primarily from altered ionization efficiency caused by co-eluting components such as endogenous and exogenous compounds, buffer constituents, and potential impurities [13].
Several factors have been hypothesized to cause the signal suppression widely reported in LC-MS [14,15]. The main ones include the competition between the analyte and co-eluting compounds for the available charge and access to the droplet surface, changes in liquid phase viscosity affecting spray formation and evaporation, formation of solid particles and/or analyte binding, the ion-pairing reactions between analytes/co-eluting compounds, and neutralization of analytes. These factors contribute to analyte-dependent behavior [3,[16], [17], [18], [19]]. The type of ionization source can also significantly affect the extent of ME suppression and/or enhancement [3,[16], [17], [18], [19]]. To date, only one hypothesis has been proposed to explain ME enhancement, suggesting that matrix components may act as dopants, i.e., as additives that enhance ionization efficiency thereby increasing the analyte signal [20].
The ME can be compensated, minimized, and/or eliminated. The compensation approaches include the use of stable isotopically labeled internal standard (SIL-IS) and external calibration using matrix-matched samples. ME can be minimized by sample dilution, appropriate sample preparation methods that effectively remove matrix components, modification of ionization conditions and/or change of ion source type, and re-optimization of the separation method to avoid the co-elution of matrix compounds [2,16,21]. Unfortunately, it is often impossible to completely eliminate the ME from LC-MS analyses; therefore, their compensation is required.
Several strategies have been proposed for the ME evaluation. First, post-column infusion is suggested for qualitative ME evaluation. Ionization suppression or enhancement can be observed as positive or negative MS signal changes from the chromatographic baseline [14,16]. Second, the post-extraction addition approach described by Matuszewski et al. [8] allows the quantification of matrix effects. This method compares the peak area of the standard dissolved in a selected dilution solvent (A) with the peak area of a blank matrix sample extracted by an optimized procedure and subsequently spiked with the analytes at the same concentration as the standard sample (B). The equation is ME = B/A ∗100 (Eq. (1)). A value of less than 100% indicates ion suppression, while a value exceeding 100% indicates ion enhancement [8,14,17]. Chambers et al. further modified the Matuszewski equation [22], allowing ME to be expressed as a percentage enhancement (a value > 0%) and/or suppression (a value < 0%) of the MS signal using the equation ME = (B/A-1) ∗100 (Eq. (2)). Finally, a simple comparison of the slopes of standard and matrix calibration curves [23], here referred to as the slope-based approach, can be also used to quantify the ME according to the equation ME = ΔS/SSTD ∗100 (Eq. (3)), where ΔS is the difference between the slopes of the standard (SSTD) and matrix calibration curves (SM). This requires the selection of a regression model that fits the experimental data. Least square linear regression is commonly used to fit experimental chromatographic data to a linear calibration curve [[24], [25], [26]]. Here, the same emphasis is given to the different data points across the calibration curve. Since the absolute variation is more significant at higher concentrations, the higher points dominate the linear regression model. There are several ways to reduce this effect. Plotting the x-axis on a logarithmic scale instead of a linear scale allows the data points to be spread over the entire range. Another way is to weigh the data inversely with the concentration. These transformations should also reduce the overall method error and improve the quality of the analytical results [24]. Thus, they also affect the evaluation of matrix effects.
ME evaluation is an integral part of LC-MS analyses of complex samples. However, various method validation guidelines propose different procedures for ME assessment depending on the availability of blank matrix and the sample preparation strategy [[27], [28], [29], [30]]. Currently, the post-extraction addition method is the method of choice in regulated bioanalytical laboratories, as it is defined in several guidelines, such as the EMA guideline [27]. Nevertheless, a number of guidelines still require the evaluation of calibration curve slopes as a necessary step in ME evaluation [3]. However, the extent to which these approaches provide comparable quantitative results has not been systematically assessed.
The main objective of this study was to systematically evaluate two quantitative approaches for matrix effect evaluation, i.e., the post-extraction addition and slope-based approach, using serum as a complex matrix and a non-selective protein precipitation procedure. Based on the observed limitations of slope-based evaluation, a novel intercept-based equation for the calculation of translational matrix effects was introduced. By combining translational matrix effects derived from calibration curve intercepts with rotational matrix effects derived from calibration curve slopes, the new approach provides a more reliable and comprehensive framework for ME evaluation. The accuracy and applicability of the new approach were subsequently demonstrated using a validation set of compounds analyzed in three different matrices on two various UHPLC–MS/MS platforms.
2. Materials and methods
2.2. Ultra-high performance liquid chromatography-tandem mass spectrometry
All evaluation experiments were carried out on an Acquity Ultra Performance LC (UPLC) system (Waters, Milford, MA, USA) coupled to a Micromass Quattro Micro API benchtop triple quadrupole mass spectrometer (Waters, Milford, MA, USA). A volume of 5 μL was injected on an Acquity BEH C18 analytical column (100 mm × 2.1 mm; 1.7 μm). The analytes were separated under gradient elution with 0.1% formic acid in water (eluent A) and ACN (eluent B) at a flow rate of 0.3 mL min−1. The gradient started with 5% of eluent B and increased to 98% over 8.5 min. The isocratic step at 98% eluent B was then kept for 1.5 min at the end of the gradient. At 10.1 min, the percentage of eluent B was returned to the original conditions of 5%. The total chromatographic analysis time, including column equilibration, was 12 min. The triple quadrupole was operated in electrospray (ESI) mode individually in positive and negative polarity. The conditions were set up as follows: capillary voltage 0.75 kV in ESI positive and −2.5 kV in ESI negative, RF lens voltage 0.5 V; extractor voltage 3.0 V; source temperature 130 °C. The desolvation gas (nitrogen) flow was set at 800 L hr−1 and at a temperature of 450 °C. Nitrogen was also used as a cone gas with a flow rate of 120 L h−1. Argon was used as a collision gas. Selected reaction monitoring (SRM) transitions were optimized for each analyte in ESI positive and ESI negative to select appropriate precursor ion, fragment ion, cone voltage, and collision energy. The final SRM transition settings are listed in Supplementary Material (SM) Table S1. The MassLynx 4.1 software was used for data acquisition, and TargetLynx software for peak integration and data processing.
Validation experiments of new approach were measured on two UHPLC-MS/MS systems, ACQUITY UPLC I-Class system (Waters, Milford, MA, USA) coupled with Xevo-TQ-XS triple quadrupole (Waters, Milford, MA, USA) and Agilent 1290 Infinity II UHPLC system coupled with an Agilent 6495 Triple Quadrupole MS system (Agilent Technologies, Santa Clara, USA). The validation set of analytes was separated on an Acquity BEH C18 analytical column (100 mm × 2.1 mm, 1.7 μm) following the injection of 2.5 μL of the sample. Gradient elution using 0.1% formic acid (A) and acetonitrile (B) at flow rate 0.35 mL/min were used in this program: 0 – 5 min, 2 – 98% ACN followed by 2 min column equilibration at 2% ACN. The column temperature was maintained at 40 °C and the autosampler temperature was set at 8 °C. The Xevo-TQ-XS system was operated with ESI source in separate experiments in positive and negative ion modes under the following conditions: capillary voltage 2.0/−1.0 kV (ESI positive/ESI negative), ion source temperature 150 °C, desolvation temperature 500 °C, cone gas (nitrogen) flow 300 L/h, desolvation gas (nitrogen) flow 1200 L/h, nebulizer gas (nitrogen) pressure 7.0 bar. The Agilent 6495 Triple Quadrupole system with ESI source in the positive mode was set up: capillary voltage 4.5 kV, nozzle voltage 2.0 kV, drying gas temperature 250 °C and flow 12 L/min, sheath gas (nitrogen) temperature 250 °C and flow 6 L/min, nebulizer 30 psi, and high/low pressure RF iFunnel parameter 135 V/80 V. SRM transitions were optimized for each analyte and both MS/MS systems. SRM transitions and their settings for both systems are listed in SM Table S2 and S3.
3. Results and discussion
3.4. New matrix effect evaluation approach based on the calibration curve slope and intercept
The comparison of calibration curve slopes only takes into account rotational matrix effects. Thus, comparing slopes is not sufficient in cases where significant translational ME is observed. Therefore, the next step was to compare the intercepts of the standard and matrix calibration curves.
First, the statistical significance of the intercept was determined using the regression analysis. Intercepts with a p-value <0.05 were marked as significant. The comparison of intercepts for matrix and standard calibration curves was subsequently carried out only for compounds and models exhibiting statistically significant intercepts in the matrix calibration curve. For this comparison and subsequent calculation of total ME, we proposed the use of the equations (Eq. (4) and Eq. (5)) illustrated in Fig. 5.
 Analytica Chimica Acta, Volume 1413, 2026, 345642: Fig. 5. General illustration of the calculation of total ME as a sum of rotational and translational ME. IM – intercept of the matrix calibration curve, ISTD – intercept of the standard calibration curve, R LLOQ, STD – analyte response at the LLOQ levels of the standard calibration curve, ΔI – the difference between the intercepts of the standard and matrix calibration curves, MES – matrix effects calculated by comparison of slopes from matrix and standard calibration curves (rotational ME), MEI – matrix effects calculated by comparison of intercepts from matrix and standard calibration curves (translational ME).
3.5. Validation of the newly developed approach
A set of compounds not included in the original set of analytes was used to fully test the suitability and accuracy of the newly developed approach for the calculation of matrix effects based on both intercept and slope. These compounds were measured in three different matrices, i.e., urine, plasma, and apple juice, using generic UHPLC-MS/MS method and sample preparation methods. The obtained data was evaluated using the same protocol as for the original set of compounds. The new approach was used only for compounds for which the intercept was statistically significant with p-value <0.05. Fig. 6 shows boxplots summarizing differences between reference MEP and MES calculated by the comparison of slopes and ME calculated by the new approach combining intercept and slope for all three matrices in both ESI positive and negative mode at LLOQ concentrations. The newly developed protocol resulted in calculated ME significantly closer to the true MEP values with differences mostly within ± 20%. On the other hand, the results confirmed that calculation of MES based only on the slope of calibration curve is unsuitable as the differences were usually around 50% in negative mode and up to thousands of percent in positive mode, especially when measuring plasma and urine samples. All values of calculated ME for all tested compounds with statistically significant intercept are listed in SM Table S7. No significant differences were observed based on the used transformation of the data for calibration curves. This indicates that, independently of the selected data transformation, i.e., 1/X0, 1/X, or 1/X2, the new approach is suitable for ME calculation whenever the intercept is statistically significant. However, this approach is not applicable to the Ln calibration model, as discussed in Section 3.4.
 Analytica Chimica Acta, Volume 1413, 2026, 345642: Fig. 6. Boxplots summarizing the differences between matrix effects calculated by Matuszewski equation (considered 100%), and (1) matrix effects calculated by the comparison of slopes (blue), and (2) matrix effect calculated by the new approach combining intercept and slope (purple). Analytes with statistically significant intercept (SM Table S7) measured in apple juice (A, D), urine (B, E), and plasma (C, F) in positive (A-C) and negative (D-F) ionization mode. (For interpretation of the references to color in this figure legend, the reader is referred to the Web version of this article.)
The benefits of the new approach are clearly visible, for example on 17α-hydroxyprogesterone measured in plasma. MEP calculated by Matuszewski equation at LLOQ was +391%, whereas the comparison of slopes resulted in MES of −31%. Conversely, the new equations (4) and (5) taking into account the slope and intercept led to ME of +374%, closely corresponding to the reference value. Similar trends were observed for other analytes. Riboflavin exhibited ME values of +1791% when calculated using the Matuszewski equation, +56% using the slope-based approach, and +1916% using the new equations. Likewise, ethyl paraben showed ME values of +3803%, −31%, and +3602%, respectively. All the results discussed so far were focusing on LLOQ concentrations. To fully validate the proposed equations, ME were also calculated at other concentration levels. For this comparison, analytes with significant ME were selected. Fig. 7 shows that the proposed equations can be used to calculate ME at any concentration level with high accuracy as the differences between these calculated ME and the true values were less than 20% for all selected compounds, independently of the dissimilarity of the matrix and standard calibration curve.
 Analytica Chimica Acta, Volume 1413, 2026, 345642: Fig. 7. Standard (red) and matrix (blue) calibration curves for (A) 17α-hydroxyprogesterone, (B) 11-deoxycortisol, and (C) 5α-dihydrotestosterone measured in plasma and their matrix effect calculated by the new approach combining intercept and slope (pink) and by the reference Matuszewski equation (light blue). (For interpretation of the references to color in this figure legend, the reader is referred to the Web version of this article.)
The last step of the validation included application of the new approach to data obtained on different instrumentation. All so far discussed validation results were measured on Xevo TQ-XS triple quadrupole mass spectrometer (Waters). Subsequently, we measured selected samples also on 6495 Triple Quadrupole mass spectrometer (Agilent). As shown in Fig. 8, the accuracy of the new approach was independent of the used instrumentation, demonstrating its robustness and broad applicability across different UHPLC-MS/MS platforms. Indeed, different ME were obtained for the same compounds on these two different MS instruments, which is expected given variations in ESI source design and desolvation conditions (e.g., Z-Spray/StepWave ion transfer vs. Jet Stream with superheated sheath gas and iFunnel ion optics). However, the accuracy of the new approach to calculate the ME close to the values obtained by the Matuszewski equation remained unaffected. All results are listed in SM Table S7.
 Analytica Chimica Acta, Volume 1413, 2026, 345642: Fig. 8. Comparison of matrix effects calculated by comparison of slopes (full color bar), by Matuszewski equation at LLOQ (hatched color bar), and by the new approach combining intercept and slope (color dot) for selected compounds measured in urine: (1) cortisol, (2) androsterone, (3) serotonin, (4) 11-deoxycortisol, (5) isorhamnetin, and (6) ritonavir. 1/X weighting was used for data transformation for compounds (1)-(3), 1/X2 weighting for compounds (4)-(6). Results from Xevo TQ-XS (A) and Agilent 6495 Triple Quadrupole (B). (For interpretation of the references to color in this figure legend, the reader is referred to the Web version of this article.)
4. Conclusions
In the process of selecting appropriate calibration models based on % error and regression analysis, it was proven that the validity of each model is affected by the defined calibration range. An unweighted linear regression model is not appropriate for wide calibration ranges. The % errors were very high, although it provided the best coefficients of determination. On the other hand, the 1/X2 weighting and Ln transformation models were found to be suitable in terms of the acceptable % errors. However, for the 1/X2 weighting, a slight visual deviation of the response values from the linear regression was observed for some compounds. Therefore, it was necessary to either exclude the highest concentration points or use quadratic regression. The Ln transformation was the optimal choice with respect to % errors and regression analysis. This model is therefore suggested for linear regression over a wide calibration range.
The post-extraction addition ME evaluation approach confirmed the concentration dependence of ME for most compounds. In general, the slope-based approach showed significantly lower ME compared to the post-extraction addition approach recommended by the EMA guideline and considered as the reference approach. It can be concluded that none of the tested calibration models provided overestimated results compared to the post-extraction addition approach. However, several of them exhibited underestimated results. This can be explained by the fact that translational matrix effects are not included in this evaluation, as they have no effect on the slope. Therefore, it is not advisable to rely on the slope approach as an effective method for obtaining accurate matrix effect results unless a means of calculating translational matrix effects from the intercept is also available.
We propose a new equation (Eq. (4)) that allows the calculation of translational ME based on the comparison of intercepts from standard and matrix calibration curves. The sum of the translational ME from intercepts and rotational ME from the slopes (Eq. (5)) corresponded more closely to the ME determined by the post-extraction addition approach, especially in the case of the 1/X0, 1/X, and 1/X2 models. In contrast, the logarithmic transformation still produced significantly underestimated results, i.e., significantly lower ME than the ME obtained by the post-extraction addition approach and compared to the other models. Only very high rotational matrix effects affected the slope of the logarithmic model. Thus, a suitable ME calculation based on the slope and intercept has not yet been found for the Ln model. Compared to other calibration models, the ME obtained by the 1/X2 weighting model were in a better agreement with the ME obtained by the post-extraction addition approach, especially at the higher concentration levels. In combination with the translational ME calculated from the intercepts, it enabled the ME to be correctly determined without the need for post-extraction addition experiments. The accuracy of the new approach was tested by analyzing validation set of compounds in three different matrices, i.e., plasma, urine, and apple juice, using two instrumental platforms. The matrix effects calculated by new approach were close to reference values. Therefore, the applicability of the new approach was demonstrated to be independent of the matrix, instrument, and weighting scheme.