

ChromaTOF Sync is an advanced peak-finding and data alignment solution designed for sample sets acquired on LECO Pegasus BT series GC–MS systems. By extending ChromaTOF’s proven peak-finding algorithms and deconvolution capabilities, Sync enables multiple samples to be processed together, generating a single, unified peak table for the entire sample set.
This collective approach allows laboratories to move beyond isolated sample evaluation toward true sample-set intelligence. Compiled chemical information supports comprehensive non-target data review, making it easier to identify similarities, differences, and trends across complex datasets.
How ChromaTOF Sync Works
The Pegasus GC–MS platform produces exceptionally information-rich datasets. However, extracting meaningful insights from large sample sets can be challenging without specialized tools. ChromaTOF Sync addresses this by co-processing BT data, leveraging shared chemical information across all samples to align peaks, refine deconvolution, and generate one consolidated peak table.
 LECO: ChromaTOF Sync
By using the full context of the dataset, Sync delivers results that are greater than the sum of individual analyses. Users benefit from cleaner deconvoluted spectra, improved peak alignment, clearer trend identification, and integrated statistical tools that accelerate confident data interpretation.
Advanced Data Processing and Visualization
ChromaTOF Sync was developed and validated using real-world experimental datasets. Retention time shifts, difficult peak shapes, and wide analyte dynamic ranges are automatically corrected and aligned, simplifying downstream review.
 LECO: ChromaTOF Sync
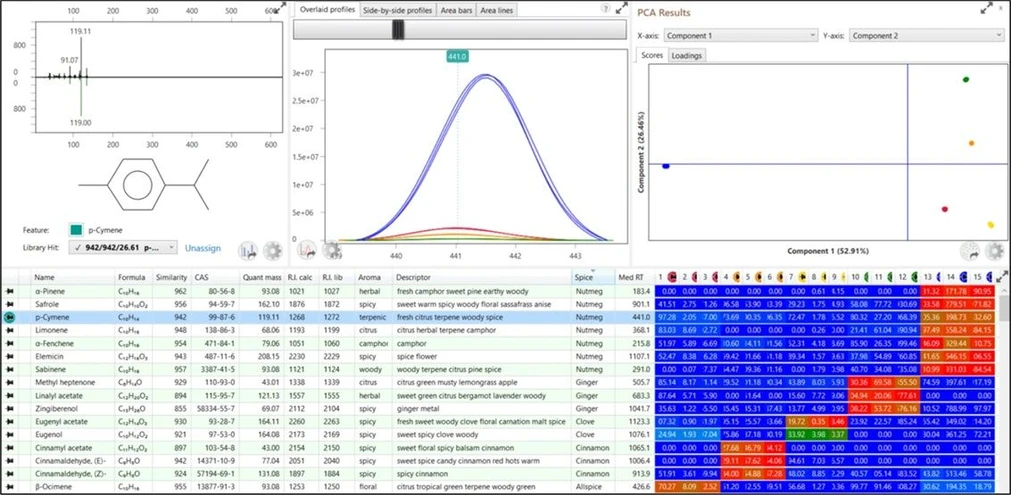
The interactive application interface provides:
- Combined peak tables for the full sample set
- Overlaid chromatograms for direct comparison
- High-quality deconvoluted mass spectra
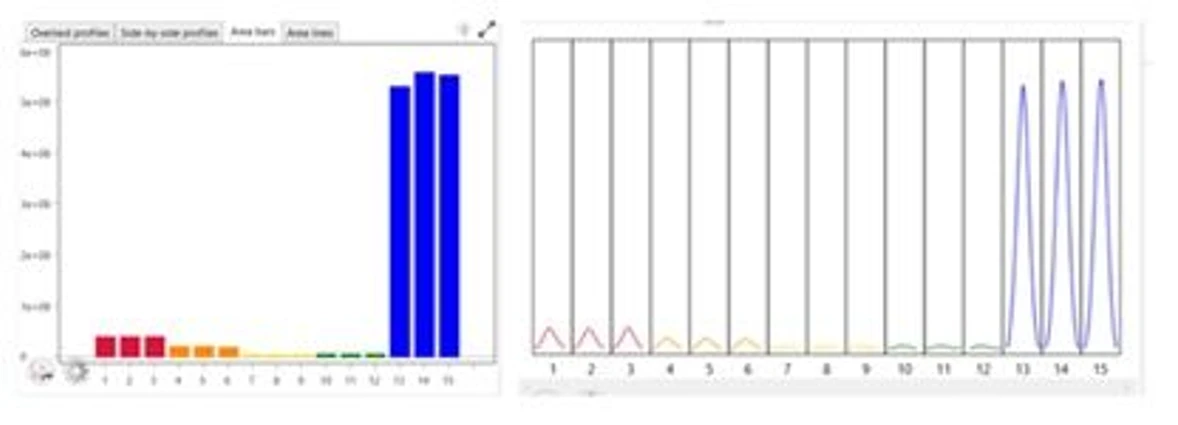
- Interactive plots highlighting peak shape, repeatability, and trends
- Spectral filters and visualization tools for monitoring chemical behavior across samples
These features enable efficient exploration of complex datasets without manual reconciliation of individual files.