Mo, 9.11.2026 | Original article from: Environ. Sci. Technol. (2026) 60 (27): 19336–19346
A new NIST Py-GC/MS search tool and spectral library enable qualitative identification of polymers, copolymers, mixtures, and polymers in complex matrices.NIST Polymer Pyrolysis Search: A New Pyrolysis GC–MS Search Program and Mass Spectral Reference Library
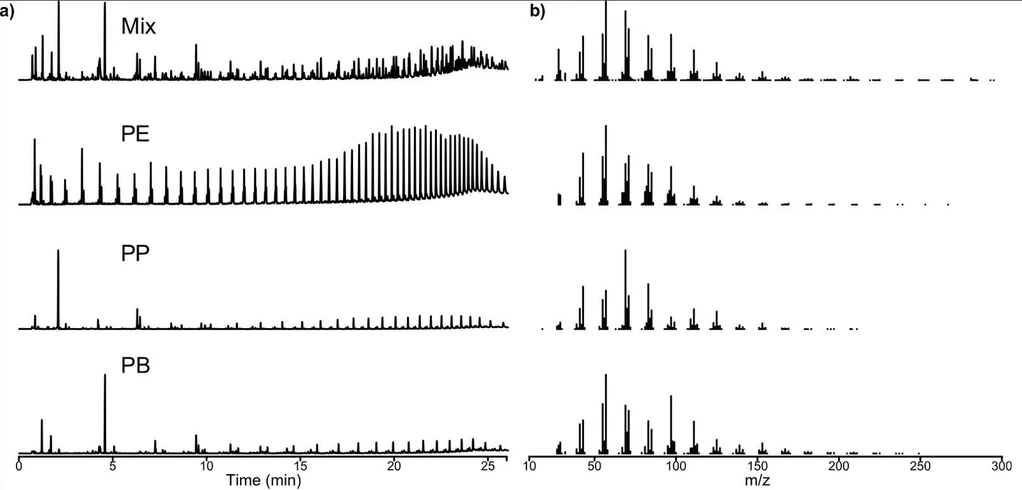
Environ. Sci. Technol. (2026) 60 (27): 19336–19346: Figure 4. (a) Pyrograms and (b) combined MS of polyolefin mixture (Mix), PE, isotactic PP (PP), and isotactic PB (PB). Note marker compounds are too numerous to demarcate clearly on the pyrograms.
This work introduces the NIST Polymer Pyrolysis Search, a freely available software application and mass spectral reference library for qualitative polymer identification by pyrolysis GC–MS. The approach identifies and deconvolutes polymers by searching characteristic pyrolysis products against a dedicated library.
The method successfully distinguished polyolefins, complex polymer mixtures, copolymers from their corresponding homopolymers, and polymers embedded in biological matrices. The searchable library expands Py-GC/MS capabilities for rapid characterization of complex polymer-containing materials.
The original article
NIST Polymer Pyrolysis Search: A New Pyrolysis GC–MS Search Program and Mass Spectral Reference Library
Edward P. Erisman* ; Yamil Simón-Manso; William E. Wallace
Environ. Sci. Technol. (2026) 60 (27): 19336–19346
https://doi.org/10.1021/acs.est.5c18872
licensed under CC-BY 4.0
Selected sections from the article follow. Formats and hyperlinks were adapted from the original.
Chemical analysis of polymers, including copolymers and polymer blends, is challenging particularly when they are present in low concentrations and as small particles in complex matrices. This is due to a variety of factors, including high molecular weights, low volatilities, different solubilities, and varying responses to temperature change. However, accurate and confident identification of polymers is essential for industry, healthcare, and environmental sciences. Polymer analysis can be destructive or nondestructive. Nondestructive methods include optical spectroscopy techniques. (1−5) Most prominent among destructive methods are mass spectrometry (6−9) often coupled with a decomposition step. In particular pyrolysis–MS, (10) and pyrolysis–GC/MS (11) (py–GC/MS) play an important role in polymer analysis. Decomposition can be achieved thermally in an inert environment (pyrolysis) or chemically (such as by hydrolysis, (12) thermally assisted hydrolysis/methylation (THM), (13−15) or alkali fusion (16)) either prior or in-line with the instrument. Degradation such as hydrolysis, THM, or alkali fusion could be part of a scheme to remediate complex matrix effects or for polymer identification. A comprehensive review detailing the fundamentals of py–GC/MS, specifically focusing on its application in environmental analysis, organic matter characterization and microplastic identification can be found in the literature. (17) Also, fundamental applications and industrial uses are well documented. (18, 19) The technique’s ability to qualitatively and quantitatively identify plastics within solid multicomponent blends (e.g., combinations of polyethylene, polypropylene, polystyrene, polyamide, and polycarbonate) by isolating their characteristic pyrolysis products has also been shown. (20) While py–GC/MS is a long-standing technique used to identify polymers, recently it has been pointed out that significant challenges remain for the accurate analysis of difficult samples, such as microplastics in complex biological matrices. (21, 22)
Confidence and ease of accurate polymer identification is greatly aided by using reference libraries. Pyrolysis libraries generally fall into three categories: chromatogram-based, (23) combined (18, 24) or direct (25) mass spectral-based, and marker compound-based. (26) Chromatogram-based searches do not use mass spectral information. Instead, they make a match based on the shape of the chromatogram. This is much more difficult when a sample contains multiple polymers and/or is in a complex matrix. Direct or combined mass spectral-based searches do not use chromatographic information. Either there is no chromatographic separation (such as py–MS), or the mass spectra of the chromatographic peaks are extracted and summed together. Using this method, it is difficult to deconvolute polymer mixtures and/or complex matrices. Commercial pyrolysis search software exists using this method. Marker compound-based (24) libraries rely on identifying one, or ideally more, unique pyrolyzate(s) to identify the polymer. Knowledge of which pyrolyzate(s) to count as a marker compound is essential to the performance of this technique because a specific chromatographic peak could arise from the pyrolysis of different polymers, or the pyrolysis of a matrix component, or be part of the matrix itself. ASTM International standard D 8401 (27) could be considered as an example of this method although the identification of individual marker compounds is accomplished by specific fragment ions and therefore is not as robust as whole spectrum matching.
The NIST Mass Spectrometry Data Center generates mass spectral libraries and search software to interact with this standard data to aid users in identifying compounds. (28) This py–GC/MS work is part of a broader focus on generating mass spectral libraries for plastics and plastic related compounds. (29) Herein we describe a different approach to py–GC/MS data analysis by implementing a pyrolyzate compound library and retention index (RI) constrained library search to putatively identify the marker compounds in an automated fashion for the attribution of the parent polymer. The retention index of an analyte relates its retention time to those of two standards (often n-alkanes) eluting before and after it. The retention index is roughly independent of experimental differences (column flow, oven temperature ramp rate, column phase ratio, etc.) for a given column phase allowing for more accurate chromatographic comparisons between systems. The aim is to create a scheme that easily identifies the polymers present in a mixture, is robust to changes in sample conditions, pyrolysis, and chromatography, and requires minimal user input. The result is a data analysis scheme and corresponding computer application, NIST Pyrolysis Polymer Search (NIST PPS), that implements an RI constrained mass spectral library search that putatively identifies multiple marker compounds and attributes them to the parent polymer. Some general limitations of pyrolysis are only briefly mentioned and possible strategies to overcome those limitations are demonstrated to not preclude using this method of analysis. Since the result of this work is a software tool to aid in the analysis of pyrolysis data, no specific claim is made regarding what constitutes necessary and sufficient support for any conclusion derived from this work.
This work is an initial step toward confident qualitative identification. Correct qualitative identification is necessary before any attempts at quantitative analysis can be made. Both qualitative and quantitative analysis depend on the reproducibility of py–GC/MS which is beyond the scope of this work.
2. Materials and Methods
2.1. Material Selection, Sample Preparation, and py–GC/MS Method
A JEOL GC-Alpha GC–MS system (JEOL AccuTOF MS with an Agilent 8890 GC) coupled to a Gerstel pyrolysis system and Gerstel programmable temperature vaporizer inlet with liquid nitrogen cryo-trapping was used in this work. The Gerstel system has a pyrolysis filament within a thermal desorption unit (TDU) connected to the GC inlet liner by a short transfer line (liner-in-liner). The majority of this work used a ramped pyrolysis method, and the unit was operated in evolved gas mode (simultaneous temperature ramp of TDU and pyrolyzer at the same rate). The TDU was ramped from (90 to 350) °C at 5 °C/s (after a 0.5 min delay), the pyrolyzer was ramped from (100 to 800) °C at 5 °C/s (with no delay), the TDU transfer line was kept constant at 315 °C and the GC method was started 0.5 min after the pyrolyzer was turned off. Flash pyrolysis methods were used for comparison. The TDU was heated at 5 °C/s from (60 to 320) °C and held with the pyrolyzer turned on at the specified temperature (450, 500, 650) °C for 0.2 min and then turned off for 0.5 min after which the GC method was initiated. For both methods, the pyrolyzates were cryo-trapped in the inlet at −120 °C during pyrolysis and the inlet was heated at a rate of 5 °C/s up to 400 °C at the start of the chromatographic run. The GC inlet was operated in “solvent vent” mode with a vent flow of 100 mL/min and a purge flow of 50 mL/min at 0.01 min. The vent flow ensures consistent pyrolytic conditions, and the purge flow can be adjusted as the split ratio for the chromatographic run. The GC chromatographic conditions were as follows: GC column: 15 m × 0.25 mm × 0.25 μm RXI5-HT (Restek); flow 1.2 mL/min; oven ramp 40 °C (3 min hold) 15 °C/min to 400 °C (2 min hold) operated in constant flow mode. The mass spectrometer was operated at 70 eV with a GC transfer line temperature of 330 °C, an ion chamber (source) temperature of 250 °C, an m/z range of 10 to 800, and a recording interval of 0.40 s. Samples were placed in a previously flame-cleaned (hand-held butane torch) quartz tube 25 mm long (open both ends) with a small piece of quartz filter (PALL Life Sciences) placed 17 mm from the top to hold the sample.
3. Results and Discussion
3.2.2. Polyolefin Discrimination
Discriminating polyolefins is challenging because of the large number of pyrolyzates and common or similar pyrolyzates from the different polyolefins. Figure 4 shows the pyrograms of PE, PP, and PB and a mixture of the three polyolefins as well as the combined mass spectrum for each, and Table 2 summarizes the NIST PPS and combined mass spectrum search results.
Environ. Sci. Technol. (2026) 60 (27): 19336–19346: Figure 4. (a) Pyrograms and (b) combined MS of polyolefin mixture (Mix), PE, isotactic PP (PP), and isotactic PB (PB). Note marker compounds are too numerous to demarcate clearly on the pyrograms.
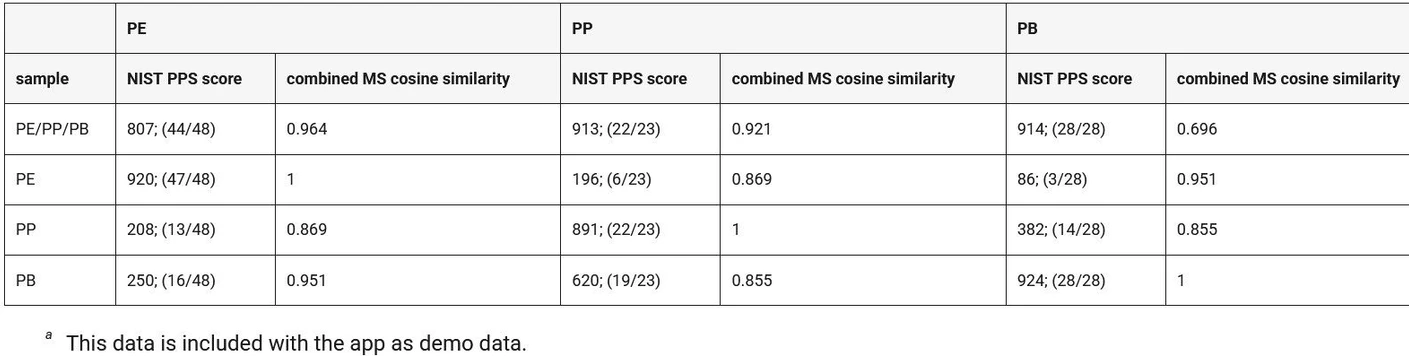 Environ. Sci. Technol. (2026) 60 (27): 19336–19346: Table 2.Comparison of Results from NIST PPS and Combined MS Methods for a Mixture of Polyolefins
The cosine similarity between the combined mass spectrum of the sample to the standards was calculated: Mix/PE─0.964, Mix/PB─0.969, Mix/PP─0.921. The cosine similarities between the combined mass spectra for the reference PE/PP/PB were also calculated: PE/PP─0.869, PE/PB─0.951, and PP/PB─0.855. The high similarities between the individual polyolefins indicate that it is difficult to differentiate the polyolefins using this technique. Using NIST PPS the final polymer scores are 914; (28/28) for iso-PB, 913; (22/23) for iso-PP, and 807; (44/48) for PE. Of note, as currently implemented NIST PPS, is very sensitive to deviations in RI especially for early eluting compounds. This is partly due to the RI tolerance being specified as RI/100 and partly due to the calibration of RI from a C7–C40 n-alkane mix making RI values less than 700 unreliable. This can be mitigated by changing the match factor cutoff; better handling of the RI is an active area of investigation. In this instance the depressed score for PE in the mixture is partly due to the RI mismatch penalty for 1-hexene (library RI of 621), giving rise to a match factor penalty of 208, resulting in a modified match factor of 730. Also, since this is a complex mixture successful deconvolution of overlapping peaks is difficult resulting in some markers not being detected. NIST PPS scores for the pure polymers were not the maximum (e.g. PE score is 920; 47/48 vs maximum of 999; 48/48) due to experimental variation in the RI and mass spectra, whereas the summed MS used for cosine similarity were the maximum of 1 because they were only generated and used for this comparison. There are very few common pyrolyzates between the polyolefins, but many are similar enough in retention time and mass spectral similarity to be attributable as a pyrolyzate from multiple polyolefins.
3.2.5. Discrimination of Polyolefins in a Complex Matrix
As previously mentioned, the misidentification/over quantitation of PE in biological samples is a concern (21) due to the fat and protein content. The pyrolysis of proteins generates an elevated chromatographic baseline which makes it difficult to detect PE, and flash pyrolysis of fats can generate common pyrolyzates to PE. The flash pyrolysis of fats generating pyrolyzates common to PE could be an artifact of specific experimental parameters as attempts to replicate this issue with our system have had minimal success (see Supporting Information S5). One strategy to mitigate this is to remove the matrix prior to pyrolysis. A version of this was tested to see if it would interfere with the performance of the app. A consumer protein powder drink mix was used as a surrogate for a complex biological matrix and pyrolyzed, resulting in a complex pyrogram that is difficult to deconvolute. Using the combined MS method, the unadulterated protein powder has a cosine similarity of 0.513 with PE while with NIST PPS the PE score is 0; 0/48. The high cosine similarity score is due to the complex pyrogram and pyrolyzates having somewhat similar spectra to PE. An approximate 7:1 mixture by mass of protein powder to PE was prepared and pyrolyzed. The pyrograms and combined mass spectra are shown in Figure 7 and Table 5 summarizes the NIST PPS and combined mass spectrum search results. The background due to the protein powder was significant, and analysis with NIST PPS resulted in a score of 493; (29/48) for PE vs 0.470 for the combined mass spectrum. This final score is relatively low, as only 29 of 48 markers for PE were detected due to the high background. Upon inspection of the chromatogram, the user could decide whether such a score would be acceptable for identifying PE. An online pretreatment THM step was performed before the pyrolysis to determine whether it would help eliminate matrix interferences of PE. This THM step was carried out by adding TMAH to the sample mixture in the pyrolysis tube and heating it at a temperature lower than pyrolysis. Analysis of the THM data of the protein powder/PE mixture detected no PE pyrolyzates indicating no PE breakdown occurring during this step (not shown). The residue in the pyrolysis tube was then pyrolyzed with the normal ramped pyrolysis method. Analysis of the pyrolysis data indicated continued elevated background, but PE was detected with an improved score of 826; (45/48). On the other hand, the combined MS method performed approximately the same (0.476 vs 0.470) as without pretreatment. Optimization of the THM pretreatment conditions could possibly improve this result perhaps even to a mixture of lower PE concentration that is biologically plausible. Obviously, if one uses a pyrolytic method in which the pyrolysis of fats generates pyrolyzates common to PE, NIST PPS will not eliminate misidentification, but we demonstrate that a harsh THM pretreatment step does not interfere with using this data analysis method.
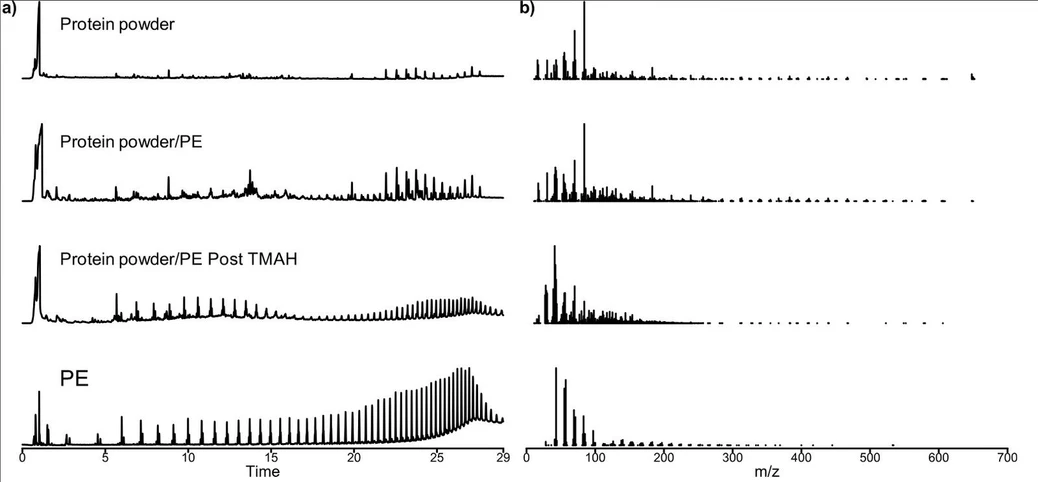 Environ. Sci. Technol. (2026) 60 (27): 19336–19346: Figure 7. (a) Pyrograms and (b) combined MS of protein powder, protein powder/PE mixture, pyrolysis of post THM material, and PE. Note marker compounds are too numerous to demarcate in the figure.
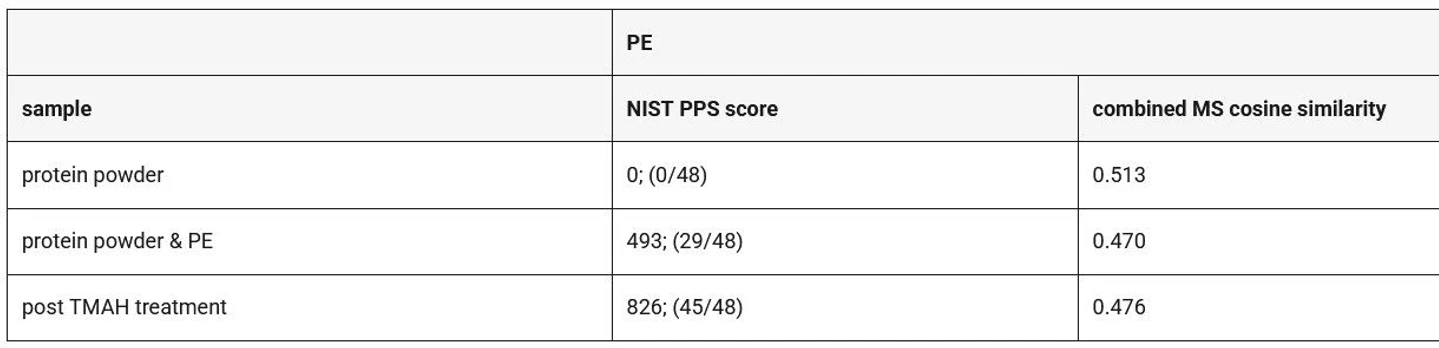 Environ. Sci. Technol. (2026) 60 (27): 19336–19346: Table 5.Comparison of Results from NIST PPS and Combined Mass Spectrum Methods for Polyethylene in a Complex Matrix
3.3. Implications and Future Directions
This work demonstrates an increase in the identification confidence of polymers, polymer mixtures, and even polymers blended with complex matrices using NIST PPS, a purposely designed pyrolysis library and search app. The library and search app are freely available as a self-contained download (no other software needed).
While the results presented here indicate the promise of an approach based on the automated searching of a pyrolyzate reference library and consideration of multiple pyrolyzates marker compounds, significant future work is needed to fully understand the performance and limitations as the effort so far has encompassed a limited number of materials and experimental conditions. Future efforts are needed related to expanding the library (including catalytic pyrolysis), investigating the impact of experimental conditions, and in refinement of the search app.
First, additional polymers need to be added to the library. In addition to expansion of types of polymers, investigation of differences in grades (e.g., molecular weight and additives) would be fruitful for understanding robustness. Prioritizing which polymers and copolymers to include next is an ongoing process. In principle, a natural continuation of this process will be adding real-world materials with high levels of additives, provided the quality control of the library is acceptable, as these materials would be an excellent test for the library and search app performance.
Second, an expanded investigation of the impact of experimental conditions is needed. For example, investigating the changes in pyrolyzates for different pyrolysis temperature ramp rates is of interest. Testing different thermochemolytic reagents may be a fruitful line of inquiry. It is possible that improvements in speed and/or sample loading can be made without degrading the chromatographic separation to an undesirable level by using low-pressure gas chromatography.
Third, continued refinements of the search app are desired. Further testing on how to best treat RI differences in pyrolyzates is an area of interest. This is especially important for areas where RI calibration compounds are absent or where chromatographic resolution is minimal (close to the void volume or elevated temperature).
This work attempts to move forward the state of qualitative identification. An important part of this analysis should include quantitation and can only be addressed after reasonably accurate qualitative identification has been made and is beyond the scope of this work.
While the results, approach, and future directions identified here indicate promise in improving polymer identification via py–GC/MS, significant challenges remain for the rapid and robust determination of the composition and concentration of polymers in complex samples.