Mo, 26.10.2026 | Original article from: J. Phys. Chem. C (2026) 130 (34): 12224–12231
Real-time LEEM/LEED shows that oxygen partial pressure strongly controls hematite surface recovery, with H-phase growth slowing sharply below ~2 × 10⁻⁶ mbar.Oxygen-Pressure-Limited Recovery of the Hematite α-Fe2O3(0001) Surface from a Reduced Fe3O4(111)-like Layer
J. Phys. Chem. C (2026) 130 (34): 12224–12231: Figure 1. Surface characterization of hematite (H-phase) and reduced magnetite (R-phase).
This study uses real-time low-energy electron microscopy and diffraction (LEEM/LEED) to investigate oxidation of a reduced Fe3O4(111)-like layer back to hematite α-Fe2O3(0001). Complete surface recovery was linked to nucleation and lateral growth of a two-dimensional honeycomb phase.
The experiments show that oxygen supply, rather than simple Arrhenius behavior, limits growth kinetics. H-phase growth slows markedly below approximately 2 × 10⁻⁶ mbar O2, while temperature mainly accelerates nucleation. The results clarify the interplay between oxygen pressure, temperature, and chemical potential in hematite oxidation and may aid optimization of catalytic and industrial surface processes.
The original article
Oxygen-Pressure-Limited Recovery of the Hematite α-Fe2O3(0001) Surface from a Reduced Fe3O4(111)-like Layer
Nishant Kumar; Matthias Blatnik; Jan Čechal*
J. Phys. Chem. C (2026) 130 (34): 12224–12231
https://doi.org/10.1021/acs.jpcc.6c04691
licensed under CC-BY 4.0
Selected sections from the article follow. Formats and hyperlinks were adapted from the original.
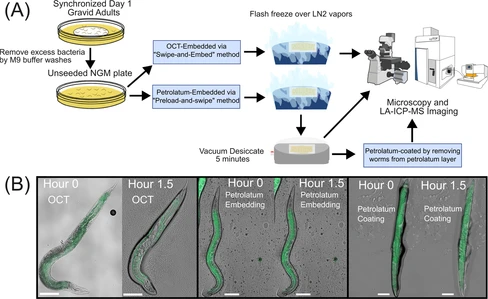
In this study, we established an integrated workflow consisting of sample preparation, imaging, and quantitative data analysis for whole-animal elemental imaging of C. elegans by LA-ICP-TOF-MS using petrolatum as a preferred embedding medium and achieved 2-μm spatial resolution with laser ablation oversampling. Compared to water-based embedding media, hydrocarbon-based petrolatum showed excellent preservation of C. elegans while retaining sufficient optical transparency for microscopy visualization, possessed the necessary nonvolatility for long-term storage, and was elementally pure for high-quality LA-ICP-MS imaging. With the assistance of a home-designed 3D-printed tool, uniform layer media application tool (ULMAT), embedding medium was applied as a uniform layer on top of charged microscope slides for on-slide embedding, freezing, and subsequent elemental analysis of C. elegans. An optional and additional step was also used to extract embedded worms from the embedding media layer to prepare petrolatum-coated worms. Comparisons between petrolatum-embedded worms and petrolatum-coated worms were also made to evaluate sample integrity and imaging data quality. Through several time-series experiments at ambient conditions, we evaluated sample integrity under different sample preparation approaches to determine optimal imaging time frames such that tissue decay and metal delocalization did not impede the accuracy of elemental imaging. We then characterized LA-ICP-TOF-MS imaging artifacts indicative of the stages of sample desiccation. We applied an oversampling technique in LA-ICP-TOF-MS imaging and achieved a 2-μm spatial resolution, providing high resolution imaging of C. elegans elemental content. Finally, using metal-spiked gelatin standards and ImageJ-based data analysis pipeline, we developed quantitative LA-ICP-TOF-MS imaging workflow and successfully produced quantitative elemental profiling of key biological elements in C. elegans.
2. Methods
Sample preparation, LEEM, and XPS characterization were performed in an ultrahigh-vacuum (UHV) system at the CEITEC Nano Research Infrastructure. The system comprises multiple UHV chambers interconnected by a UHV transfer line, allowing sample transfer between chambers via the UHV transfer line, maintaining a base pressure of 2 × 10⁻¹⁰ mbar.
2.2. Low-Energy Electron Microscopy/Diffraction
Experiments were conducted using a Specs FE-LEEM P90 instrument. Bright-field images were measured by capturing electrons collected from the central (0,0) diffracted beam. Diffraction patterns were acquired from a surface area of approximately 7 × 15 μm2 without aperture confinement. The coverage of the H-phase was determined using ImageJ software as the difference between the areas of the R- and H-phase regions.
X-ray Photoelectron Spectroscopy (XPS) analysis was performed using a Specs system equipped with a Phoibos 150 spectrometer. Measurements were performed with a nonmonochromatized X-ray source emitting Mg Kα radiation (hν = 1253.6 eV), at 0° emission angle, utilizing the high-magnification mode with a 15 mm iris aperture. Core-level spectra were acquired with a pass energy of 20 eV, a step size of 0.1 eV, and a dwell time of 0.1 s. No charging effects were observed during the measurements.
3. Results
3.1. Initial Surface Preparation and Characterization
To establish a stable, controlled starting surface for the oxidation studies, we used an α-Fe2O3(0001) hematite single crystal featuring the 2D honeycomb phase fully covering the surface. This surface is referred to as the H-phase in the following text. Samples featuring H-phase were subsequently reduced to magnetite Fe3O4(111) through four cycles of Ar+ sputtering and UHV annealing at 640 °C (see Methods section for details). Sputtering selectively removes surface oxygen atoms, reducing the near-surface volume to stoichiometric Fe3O4, forming a ∼20–25 nm thick layer that maintains the epitaxial relationship with the bulk Fe2O3 hematite. (6) We will refer to this surface as the R-phase in the following text.
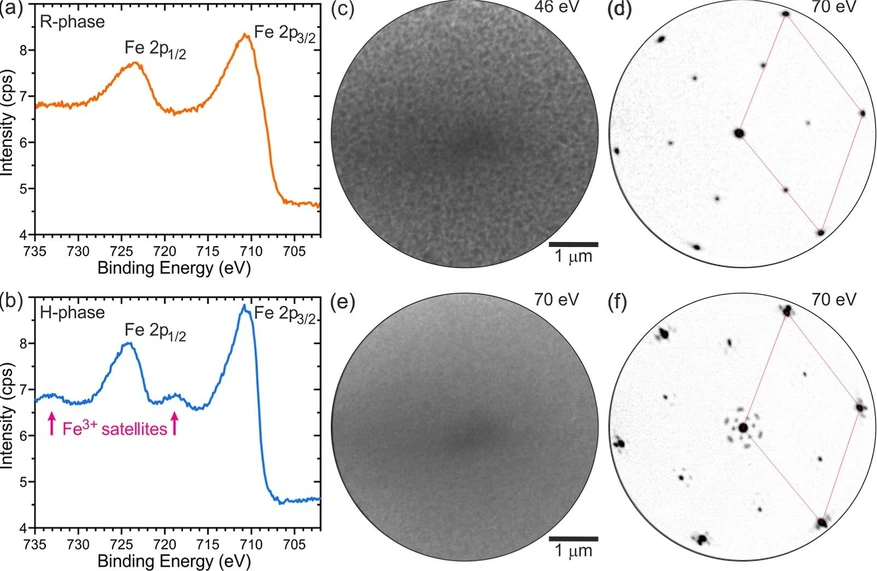
The transition between the H- and R-phases was characterized using X-ray Photoelectron Spectroscopy (XPS) and Low Energy Electron Microscopy/Diffraction (LEEM/LEED). In the XPS spectrum of the R-phase (Figure 1a), the Fe3+ satellite peaks are absent, whereas in the H-phase spectrum (Figure 1b), the satellite peaks are present, confirming the oxidation state. (29−31) LEEM/LEED provide complementary real and reciprocal-space views, elucidating the sample morphology at the mesoscale and its structure, respectively. Bright-field LEEM imaging revealed a uniform and well-prepared R-phase surface (Figure 1c). (7) The corresponding diffraction pattern in Figure 1d displays (2 × 2)-Fe3O4(111) diffraction spots (referred to the O planes (6)) characteristic of this surface. (6, 7, 32) The oxidation of the surface at temperatures of 660–700 °C and oxygen partial pressures of 6.3 × 10⁻⁷–5.0 × 10⁻⁶ mbar leads to full oxidation and to α-Fe2O3(0001) featuring the H-phase; depending on the oxidation conditions, it takes 55 to 450 min. The bright-field LEEM image of the H-phase (Figure 1e) shows a uniform surface, and the diffraction pattern (Figure 1f) exhibits the characteristic flowered pattern (30, 32, 33) around the bulk spots associated with the moiré due to the presence of the overlayer. (7) We note that the maghemite surface can exhibit the same (2 × 2) surface reconstruction as magnetite; (34) therefore, maghemite and magnetite cannot be distinguished by simple diffraction experiments alone.
J. Phys. Chem. C (2026) 130 (34): 12224–12231: Figure 1. Surface characterization of hematite (H-phase) and reduced magnetite (R-phase). (a) XPS spectrum of the R-phase, confirming the absence of Fe3+ satellite peaks and the successful reduction of α-Fe2O3 to Fe3O4. (b) XPS spectrum of the H-phase, highlighting the presence of Fe3+ satellite peaks characteristic of hematite. (c) Bright-field LEEM image at 46 eV of the magnetite (R-phase) surface, showing a uniform and well-prepared morphology. (d) (2 × 2) diffraction pattern at 70 eV characteristic for the R-phase, indicative of the well-ordered surface suitable for oxidation studies. (e) Bright-field LEEM image at 70 eV showing the H-phase surface. (f) Diffraction pattern at 70 eV characteristic of the H-phase. The (1 × 1) unit cell is marked by a rhombus in (d,f).
3.2. Time Evolution of Oxidation
To obtain quantitative insights into the R- to H-phase transformation, we performed three sets of real-time LEEM/LEED experiments, keeping constant either oxygen partial pressure pO2, sample temperature T, or oxygen chemical potential μ, while varying either temperature or pressure, or in the last case, both parameters. By systematically separating the effects of these parameters, we revealed their impact on the R- to H-phase oxidation kinetics. An example of the oxidation kinetics at 660 °C and 6.3 × 10⁻⁷ mbar (μO = −1.867 eV) using real-time LEEM/LEED is given in Figure 2. During the first stage of oxidation, the entire surface shows a uniform contrast and the diffraction pattern of the R-phase. At 75 min, moiré spots became visible, which indicates H-phase nucleation (Figure 2a). We refer to this time, t0, as the nucleation time in the following. As oxidation progresses, the H-phase spots become more pronounced, while the R-phase spots progressively fade.
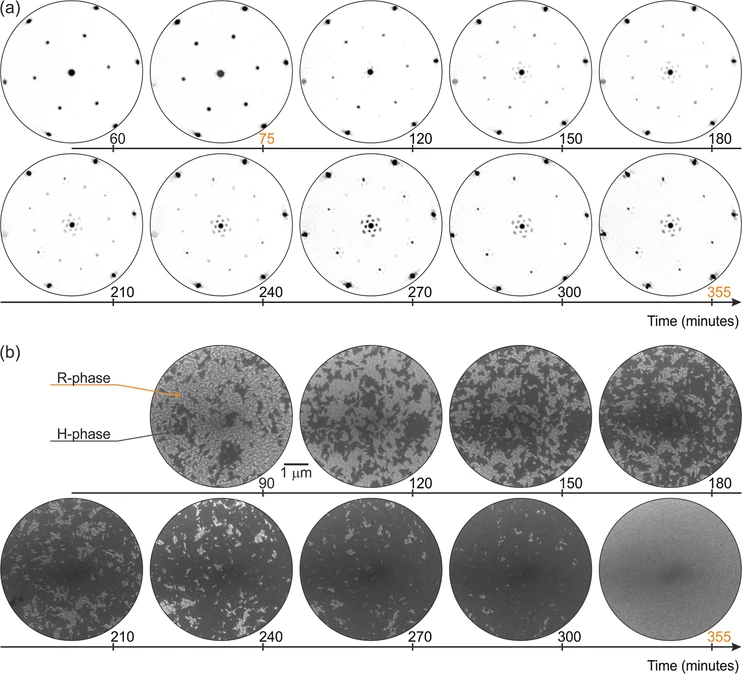 J. Phys. Chem. C (2026) 130 (34): 12224–12231: Figure 2. Surface evolution during the oxidation from magnetite to hematite at 660 °C and 6.3 × 10⁻⁷ mbar in real and reciprocal space. (a) Sequence of diffraction patterns taken at 70 eV showing the structural transformation from the R-phase to the H-phase. (b) Corresponding sequence of bright-field LEEM images capturing the transformation from the R-phase (brighter) to the oxidized H-phase (darker) over 355 min.
The bright-field LEEM image in Figure 2b illustrates the progressive transformation of the surface from the reduced R-phase to the H-phase. After nucleation, H-phase islands emerge and remain surrounded by the R-phase. As the oxidation advances, the R-phase regions on the surface gradually decrease, while the H-phase regions expand. By 355 min, the entire surface is covered by the H-phase, marking the completion of the oxidation process. The growth of the H-phase proceeds in a granular fashion, consistent with the rough growth front observed during oxidation of thin films. (24)
Conclusion
In conclusion, real-time LEEM/LEED shows that oxidation of the reduced Fe3O4(111)-like surface layer on α-Fe2O3(0001) is accompanied by nucleation and lateral growth of the H-phase. The growth kinetics show a significant dependence on oxygen supply for the surface reaction. While a slight increase in temperature slightly accelerates H-phase nucleation, lateral growth slows at constant oxygen pressure, indicating that the supply of reactive oxygen limits the surface reaction. Increasing temperature must therefore be accompanied by a sufficient increase in oxygen partial pressure to sustain the oxidation rate. Below an oxygen partial pressure of ∼2 × 10⁻⁶ mbar, the H-phase growth rate decreases dramatically, and this decrease cannot be compensated simply by lowering the temperature. The observation that residual R-phase persists until H-phase coalescence shows that complete recovery of the hematite surface termination is closely coupled to lateral H-phase growth. These results indicate a general strategy for faster oxidation of the reduced Fe3O4(111)-like surface layer, in which the pressure should be above a certain threshold and the increase in temperature should be accompanied by an increase in pressure to keep the thermodynamic driving force constant. This knowledge is important for fundamental studies of this catalytically relevant surface.