Mo, 21.9.2026 | Original article from: Food Chemistry: X, Volume 38, 2026, 104256
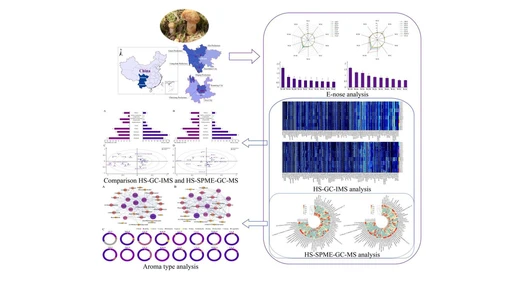
Combined GC-IMS and HS-SPME-GC-MS with chemometrics differentiates coffee peel processing treatments and identifies characteristic volatile aroma markers.Analysis of characteristic flavor compounds in coffee peels subjected to different thermal processing treatments based on GC–IMS and HS-SPME–GC–MS combined with chemical pattern recognition

Food Chemistry: X, Volume 38, 2026, 104256: Fig. 1. GC–IMS two-dimensional topographic plots of volatile compounds in SG, HAD and MD. The x-axis represents the normalized drift time (ms), the y-axis represents the retention time (s), and the color scale indicates the normalized signal intensity relative to the reaction ion peak (RIP). Higher signal intensities are represented by warmer colors (red), whereas lower signal intensities are represented by cooler colors (blue). Abbreviations: SG, sun-dried coffee peel; HAD, hot-air-dried coffee peel; MD, microwave-dried coffee peel. (For interpretation of the references to color in this figure legend, the reader is referred to the web version of this article.)
This study combines GC-IMS and HS-SPME-GC-MS with PCA, PLS-DA, and relative odor activity value analysis to investigate how different thermal processing treatments influence the volatile profile of coffee peel. The two analytical techniques provided complementary information, tentatively identifying 62 and 56 volatile compounds, respectively, dominated by ketones, aldehydes, alcohols, and esters.
Chemical pattern recognition clearly distinguished sun-dried, hot-air-dried, and microwave-treated samples and identified potential aroma markers including 2-furanmethanethiol, 3-methylbutanal, hexanal, linalool, and β-ionone. The results provide insight into processing-dependent coffee peel flavor and support optimization of cascara tea production.
The original article
Analysis of characteristic flavor compounds in coffee peels subjected to different thermal processing treatments based on GC–IMS and HS-SPME–GC–MS combined with chemical pattern recognition
Congyan Meng, Jie Wu, Chunrong Yan, Jianqiang Wei, Yuanxing Zhang, Tianjun Yuan, Ying Hou
Food Chemistry: X, Volume 38, 2026, 104256
licensed under CC-BY 4.0
Selected sections from the article follow. Formats and hyperlinks were adapted from the original.
Flavor compound analysis is a critical step in evaluating the quality of dried and processed coffee peel. Its flavor profile arises from the complex interactions among numerous volatile compounds and reactions such as the Maillard reaction and thermal degradation can significantly modify the types and concentrations of aromatic constituents (Dong et al., 2022). Hu et al. (2023) confirmed that aldehydes such as hexanal, heptanal, (E)-2-heptenal, decanal, phenylacetaldehyde, and cinnamaldehyde in coffee peels are primarily formed through intermediate or degradation products in the Maillard reaction, which impart fatty, fruity, floral, or spicy aromas to food, and 1-Octen-3-ol is a product of thermal degradation. With advances in food flavoromics, the integration of chemical analytical techniques (e.g., GC–IMS and GC–MS) with sensory evaluation has become an important and essential strategy for elucidating the relationship between chemical composition and perceived flavor (Chen, Ling, et al., 2024). As an emerging non-targeted analytical tool for volatile compounds, Gas chromatography–ion mobility spectrometry (GC–IMS) has been increasingly applied in food flavor research owing to its high sensitivity, rapid detection speed and intuitive data visualization (Xiang et al., 2025). After the processed sample enters the instrument with the carrier gas, it first undergoes initial separation through the gas chromatography column. The separated components then enter the ion mobility tube, where the analyte molecules are ionized in the ionization region. Under the influence of an electric field and a counter-flow drift gas, the ionized sample ions migrate and eventually reach the faraday plate for detection, achieving a second-stage separation (Liedtke et al., 2018; Mochalski et al., 2018). Gas chromatography–mass spectrometry (GC–MS), on the other hand, enables efficient separation and accurate quantification of volatile components (Liu et al., 2022). HS-SPME–GC–MS has been widely applied for comprehensive aroma profiling in fermented beverages and plant matrices (Herkenhoff et al., 2024a; Herkenhoff, Brödel, et al., 2026). GC–MS primarily detects volatile compounds with relatively large molecular weights and higher concentrations, typically with carbon chain lengths ranging from C8 to C20, whereas GC–IMS mainly identifies small, highly volatile compounds with lower concentrations, generally in the C4 to C10 range. The two techniques are therefore complementary and together expand the detectable range of volatile components. In particular, HS-SPME–GC–MS enables component identification by determining the relative molecular masses of volatile organic compounds and is considered a well-established technique for volatile analysis (Wu, Lin, et al., 2025). Although it offers excellent separation and identification performance, its effectiveness is somewhat limited when analyzing low-molecular weight and trace-level compounds (Li et al., 2023). In recent years, the combined application of GC–IMS and HS-SPME–GC–MS has been widely used in flavor studies of various fruits, vegetables and foods (Ge et al., 2020; Li et al., 2021; Qi et al., 2020). For example, Feng et al. (2022), Zhang et al. (2024), Zhao et al. (2025) and Huang (2025) employed this integrated approach to investigate volatile components of Sichuan pepper, fermented cheese, potato chips and tea leaves, respectively. This dual-technology strategy not only expands the detection range but also provides robust support for establishing a more comprehensive, multidimensional, and reliable flavor database. In particular, further validation through gas chromatography–olfactometry (GC–O), trained sensory panels, aroma recombination models, and omission experiments would facilitate the accurate identification of characteristic aroma-active compounds in coffee cascara. However, limited research has been conducted on applying this combined GC–IMS and HS-SPME–GC–MS technical system to examine the effects of different thermal processing treatment methods on the volatile composition of coffee peel.
This study uses sun-dried coffee peel as the raw material and combines GC–IMS and HS-SPME–GC–MS techniques to analyze the volatile components of coffee peel samples subjected to sun-drying (SG), microwave processing (MD), and hot-air processing (HAD). It systematically investigates the effects of different processing methods on their volatile flavor composition. Relative odor activity value (ROAV) analysis was employed to identify the putative aroma compounds (ROAV ≥1) in the three types of coffee peel. Chemometric methods, including principal component analysis (PCA) and partial least squares discriminant analysis (PLS-DA), were used for pattern recognition of flavor differences. Furthermore, putative aroma-related differential marker compounds among the three coffee peel samples were screened based on variable importance in projection (VIP) values. Integrated omics and flavoromic strategies have proven effective in linking metabolic pathways with aroma formation and sensory outcomes (Herkenhoff et al., 2023; Herkenhoff, Praia, et al., 2026).These approaches reveal the differences in aroma components between sun-dried and different thermal processing treatment samples and identify the aroma-active compounds contributing to the overall aroma profile of coffee peel. The results of this study aim to provide a theoretical basis for optimizing coffee peel processing techniques and for quality control in coffee peel tea products.
2. Materials and methods
2.1. Materials and instruments
FlavorSpec® flavor analyzer (G.A.S. GmbH, Germany); GCMS-TQ8050 NXnci SYSTEM gas chromatography–mass spectrometry system (Shimadzu Corporation, Japan); P80F20CN1PV-DGR (WO) microwave oven (Guangdong Galanz Microwave & Electrical Appliances Manufacturing Co., Ltd., China); XMTA-500T electric blast drying oven (Yuyao Keyang Instrument Co., Ltd., China); DFY-500 swing-type grinder (Wenling Linda Machinery Co., Ltd., China); 75 μm CAR/PDMS solid-phase microextraction fiber (Supelco, USA); 60-mesh standard sieve (Shaoxing Shangyu Daoxu Wusi Instrument Factory, China).
3. Results and discussion
3.1. GC–IMS analysis
The flavor profiles of coffee peel processed using three different thermal processing methods were analyzed by GC–IMS, and the results are shown in Fig. 1. This two-dimensional topographic map was generated by projecting the three-dimensional spectral data (Yue et al., 2025). The red peak at the center of the figure is the Reaction Ion Peak (RIP), while each signal point to the right of the RIP corresponds to a volatile organic compound (VOC). The color intensity indicates the relative concentration of each compound, with red representing higher levels and white indicating lower levels. Overall, the abundance of volatile components differed among the different thermal processing treatment methods: the MD and HAD groups displayed generally higher concentrations, whereas the SG group exhibited comparatively lower levels and showed variations in specific compounds. These differences may be attributed to the thermal effects of microwave and hot-air oven drying, which can disrupt cell walls and promote the release of volatile constituents during continuous heating. When the concentration of the analyte is high, two or more molecules may share a proton or electron, forming dimers or even multimers. These aggregated ions exhibit retention times similar to those of their monomers but differ in drift time (Li, Li, et al., 2019). Within the retention time range of 200–1400 s and drift time 10 ms–15 ms, the volatile components of the three samples exhibited distinct clustered distribution characteristics, with some signal peaks extending even to retention times as high as 1800 s. This phenomenon may be attributed to the low polarity of certain compounds, resulting in stronger retention on the non-polar chromatographic column (Chen et al., 2018). Qualitative identification of the compounds was conducted using the instrument's built-in retention index database and the GC–IMS spectral library. A total of 68 volatile compounds were tentatively identified (detailed results are provided in Supplementary Table 1). The suffixes “M” and “D” following the compound names denote monomer and dimer, respectively. The identified compounds included 15 ketones, 14 aldehydes, 13 alcohols, 12 esters, 5 hydrocarbons, 4 ethers, 2 pyrazines and 1 each of furans, acids, and heterocyclic compounds.
Food Chemistry: X, Volume 38, 2026, 104256: Fig. 1. GC–IMS two-dimensional topographic plots of volatile compounds in SG, HAD and MD. The x-axis represents the normalized drift time (ms), the y-axis represents the retention time (s), and the color scale indicates the normalized signal intensity relative to the reaction ion peak (RIP). Higher signal intensities are represented by warmer colors (red), whereas lower signal intensities are represented by cooler colors (blue). Abbreviations: SG, sun-dried coffee peel; HAD, hot-air-dried coffee peel; MD, microwave-dried coffee peel. (For interpretation of the references to color in this figure legend, the reader is referred to the web version of this article.)
3.2. HS-SPME-GC–MS analysis
The volatile profiles of coffee peel processed by three different thermal processing methods were analyzed using HS-SPME-GC–MS. A total of 56 compounds were identified and categorized into 10 chemical categories (detailed results are provided in Supplementary Table 2). Among these, ketones (14 types) were the most abundant, followed by esters (11 types), aldehydes (9 types) and alcohols (8 types). Additional compounds included acids (4 types), alkenes (4 types), phenols (3 types) and single types of ethers, pyrroles and other compounds. Specifically, 37, 44 and 50 volatile flavor compounds were detected in the SG, HAD and MD samples, respectively, indicating that microwave processing (MD) promotes greater diversity in volatile composition. The study further revealed that different thermal processing treatment processes not only induce the formation of new volatile compounds in coffee peel but also result in the loss of certain original components, highlighting the significant modulatory effect of thermal processing treatment on the composition of volatile constituents.
Fig. 5 presents a stacked bar chart illustrating the differences in VOC contents among three coffee peel samples based on the similarity of their VOC compositional profiles. The results show that the predominant volatile components in the SG sample were ketones, esters, aldehydes, alcohols, alkenes and ethers, together accounting for 97.973% of the total volatile content. In the coffee peel samples subjected to different processing methods, the main volatile constituents were ketones, aldehydes, alcohols, alkenes and ethers, with their combined proportions reaching 96.845% in the HAD group and 95.715% in the MD group. Among the volatile compounds in the SG sample, alcohols exhibited the highest relative abundance (31.119%). The principal alcohols identified were benzyl alcohol (11.790%), trans-linalool oxide (furanoid) (3.275%), linalool (6.302%), (3R,6S)-2,2,6-trimethyl-6-vinyltetrahydro-2H-pyran-3-ol (2.787%) and phenethyl alcohol (6.760%). Notably, linalool, which is characterized by a citrus-like aroma, can be biosynthesized through the catalysis of geranyl diphosphate (GPP) by monoterpene synthases or released from glycosidic precursors during thermal processing (Fu et al., 2025). The ketone content was highest in the HAD and MD samples, accounting for 44.232% and 31.739% of the total volatiles, respectively. Representative ketones included 2,3-dihydro-3,5-dihydroxy-6-methyl-4H-pyran-4-one (HAD: 27.062%, MD: 19.543%), 2,5-dimethylfuran-3,4(2H,5H)-dione (HAD: 6.958%, MD: 0.598%), 1-(1H-pyrrol-2-yl)-ethanone (HAD: 3.572%, MD: 3.895%), 1-(2-furanyl)-ethanone (HAD: 2.352%, MD: 2.897%) and 4-cyclopentene-1,3-dione (HAD: 1.253%, MD: 1.752%). The results further indicate that heat treatment markedly reduced the content of ester compounds. This phenomenon, which has been widely reported in food systems, can be attributed to the susceptibility of esters to hydrolysis or thermal decomposition under heating conditions, resulting in the formation of smaller molecules such as carboxylic acids and alcohols, consequently, a decline in ester concentration (An et al., 2019).
 Food Chemistry: X, Volume 38, 2026, 104256: Fig. 5. Relative proportions of major VOC classes based on GC–MS peak-area normalization in SG, HAD, and MD. The y-axis represents the percentage contribution of each VOC class to the total integrated GC–MS peak area.
3.3. Comprehensive analysis by GC–IMS and HS-SPME–GC–MS
The VOCs detected by GC–IMS and HS-SPME–GC–MS were visualized using a Venn diagram after merging monomeric and dimeric signals (Fig. 8). Altogether, 112 VOCs were tentatively identified by the two analytical methods; however, only six compounds—furfural, 2-furanmethanol, alpha-pinene, 1-(2-furanyl)-ethanone, nonanal, and styrene—were detected by both techniques, indicating a marked divergence between the VOC profiles obtained. This limited overlap can be attributed to differences in the detection ranges and column polarities of the two methods (MXT-WAX for GC–IMS versus RTX-5MS for GC–MS). Specifically, GC–IMS exhibits higher sensitivity toward small, highly volatile compounds (C4–C10), whereas GC–MS is more suitable for detecting larger, semi-volatile compounds (C8–C20). Aroma composition is strongly influenced by origin and processing history, as shown in comparative volatile studies of hop varieties and their terroir-dependent profiles (Herkenhoff et al., 2024b). Consistent with this distinction, GC–IMS identified substantially more heterocyclic VOCs, particularly pyrazines and furans, than GC–MS, highlighting its superior sensitivity for small heterocyclic molecules (Nolvachai et al., 2023). In contrast, GC–MS demonstrates greater capability for the enrichment and identification of high-boiling-point volatile compounds (Li et al., 2024). Therefore, the combined application of GC–IMS and HS-SPME–GC–MS exploits the complementary advantages of both techniques, compensates for the limitations inherent to each individual method, and significantly expands the analytical coverage of VOCs in complex systems.
 Food Chemistry: X, Volume 38, 2026, 104256: Fig. 8. Venn diagram illustrating the comparison of tentative VOC assignments obtained by GC–IMS and HS-SPME–GC–MS after merging GC–IMS monomer and dimer signals. The numbers represent VOCs uniquely identified by each platform and those commonly detected by both analytical methods.
4. Conclusion
In this study, a dual-platform analytical approach was employed to comparatively evaluate the effects of microwave drying (MD), hot-air drying (HAD), and traditional sun drying (SG) on the volatile composition of coffee peel. Gas chromatography–ion mobility spectrometry (GC–IMS) and headspace solid-phase microextraction coupled with gas chromatography–mass spectrometry (HS-SPME–GC–MS) demonstrated strong complementarity in the analysis of volatile organic compounds (VOCs). Specifically, GC–IMS exhibited greater sensitivity toward low-molecular-weight aldehydes, ketones, and certain heterocyclic compounds, whereas HS-SPME–GC–MS showed superior performance in the extraction and tentative identification of medium-molecular-weight alcohols, esters, and long-chain aldehydes. By integrating the results from both analytical platforms, a total of 112 VOCs were tentatively identified, although only six compounds were detected by both methods. This limited overlap indicates that a single analytical technique may be insufficient to comprehensively characterize the volatile aroma profile of coffee peel, whereas the integration of complementary analytical platforms can substantially expand the analytical coverage and dimensionality of volatile aroma characterization.
Based on the combined screening criteria of a variable importance in projection (VIP) score > 1 and a relative odor activity value (ROAV) ≥ 1, eight compounds—2-furanmethanethiol, 3-methylbutanal, (E)-2-decenal, ethyl heptanoate, hexanal, 2-phenylethanol, linalool, and β-ionone—were preliminarily proposed as potential differential aroma markers associated with processing-related flavor differences. Further estimation based on ROAV-derived aroma attributes suggested distinct putative aroma profiles among the three drying treatments. The SG samples appeared to exhibit a relatively complex estimated aroma profile, characterized primarily by putative herbaceous/vegetative, fruity, and nutty/cocoa aroma attributes. This pattern may be associated with the mild thermal conditions during sun drying, which could facilitate the preservation of thermolabile compounds such as terpenoids and lactones while allowing continued enzymatic activity. In contrast, the HAD samples exhibited a particularly pronounced putative floral aroma attribute, possibly because hot-air drying promoted the hydrolysis of glycosidically bound aroma precursors and enhanced Strecker degradation, thereby increasing the abundance of floral-related compounds such as linalool, β-damascenone, and 2-phenylethanol. Meanwhile, the MD samples appeared to combine putative floral and roasty aroma attributes. The rapid internal heating induced by microwave drying may accelerate the Maillard reaction and caramelization, leading to the formation of furans, pyrazines, and sulfur-containing heterocyclic compounds that may contribute to putative caramel-like, nutty, and smoky aroma notes.
Notably, based on the ROAV estimation, the roasty attribute exhibited an identical value of 100 across all three sample groups, tentatively suggesting that this aroma dimension may be relatively insensitive to thermal processing treatment method within the limits of this estimation approach. This phenomenon might be related to the intrinsic thermal degradation behaviour of native precursors in coffee peel, such as chlorogenic acid and trigonelline.
Overall, the findings of this study provide valuable insights for the preliminary selection of drying technologies and the flavor-oriented development of coffee peel tea products. However, the actual contributions of the identified putative aroma markers to the perceived aroma profile, together with their dynamic transformation mechanisms during processing, remain to be fully elucidated. Future research should integrate trained sensory panel evaluations with advanced analytical approaches, including gas chromatography–olfactometry–mass spectrometry (GC–O–MS) and stable isotope labeling, to validate the sensory relevance of these candidate markers and further clarify the formation pathways and interaction mechanisms of aroma-active compounds in coffee peel products.