Mo, 7.9.2026 | Original article from: Food Chemistry, Volume 508, Part B, 2026, 148447
A micro-flow LC-Q-Orbitrap HRMS method quantifies 239 pesticides in fruits and vegetables while cutting solvent consumption and waste by 25-fold.Coupling micro-flow liquid chromatography with Q-Orbitrap high-resolution mass spectrometry for greener, comprehensive pesticide residue analysis in fruits and vegetables
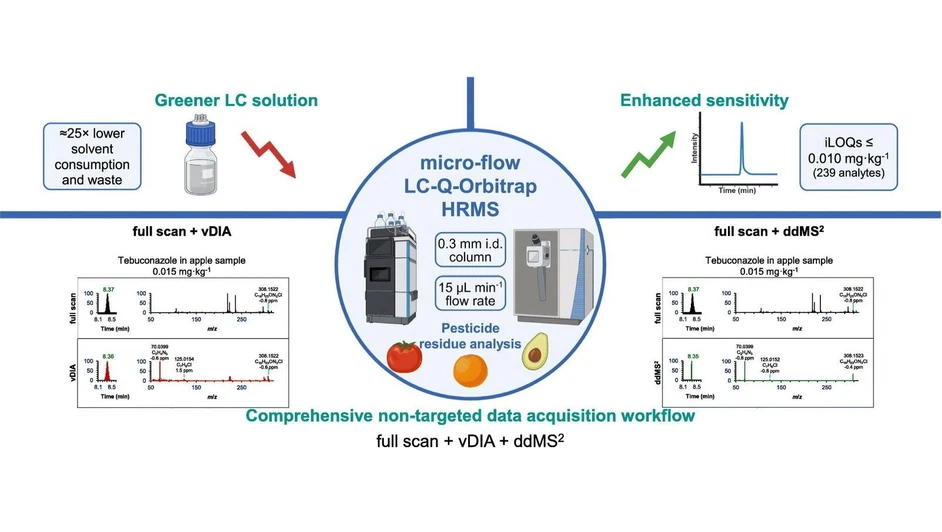
Food Chemistry, Volume 508, Part B, 2026, 148447: Graphical abstract
This study develops a micro-flow LC-Q-Orbitrap HRMS method for comprehensive pesticide residue analysis in fruits and vegetables. Combining full-scan, variable DIA, and data-dependent MS² acquisition, the workflow achieved quantification limits at or below 0.010 mg·kg⁻¹ for 239 pesticides in tomato, orange, and avocado, with good stability, linearity, and generally low matrix effects.
The method was successfully validated using proficiency tests and real samples and supports both targeted quantification and non-targeted data acquisition in a single run. Operating at 15 μL·min⁻¹, micro-flow LC also reduced solvent consumption and waste by approximately 25-fold compared with conventional LC, providing a sensitive and greener option for routine pesticide monitoring.
The original article
Coupling micro-flow liquid chromatography with Q-Orbitrap high-resolution mass spectrometry for greener, comprehensive pesticide residue analysis in fruits and vegetables
Florencia Jesúsa, Francisco José Díaz-Galianob c, Amadeo Rodríguez Fernández-Albaa
Food Chemistry, Volume 508, Part B, 2026, 148447
licensed under CC-BY 4.0
Selected sections from the article follow. Formats and hyperlinks were adapted from the original.
The coupling of liquid chromatography (LC) to Orbitrap™ mass spectrometry (MS) has fundamentally transformed high-resolution mass spectrometry (HRMS) across many areas of analytical science (Makarov & Scigelova, 2010). While the benefits of HRMS for both qualitative and quantitative analysis are well established, the high cost and operational complexity of Orbitrap platforms initially hindered their adoption in routine laboratories, such as those focused on food safety, despite growing interest in their advanced analytical performance (Eliuk & Makarov, 2015). However, over the last twenty years, Orbitrap-based HRMS has progressively established itself as a robust alternative to triple quadrupole (QqQ) instrumentation for pesticide residue analysis in food. Orbitrap-based workflows for pesticide residue analysis have evolved from basic full scan screening methods to sophisticated, multi-mode acquisition strategies (Alder et al., 2011; Huérfano Barco et al., 2022; Kaufmann et al., 2010; Kellmann et al., 2009; Kong et al., 2018; Mol et al., 2012; Rajski et al., 2021; Rajski, Gómez Ramos, & Fernández-Alba, 2017; Rajski, Gómez-Ramos, & Fernández-Alba, 2017; Sun et al., 2021; Zomer & Mol, 2015). This evolution reflects the growing analytical needs for sensitivity, selectivity, and retrospective capabilities in regulatory food analysis.
Although Orbitrap-based HRMS can rival or surpass traditional triple quadrupole approaches in terms of analytical scope and performance, it generally exhibits lower sensitivity, particularly in MS2 mode. Unlike targeted MS2 acquisition strategies, which rely on prior knowledge of the precursor ions and sometimes the compound's retention time, non-targeted approaches are less demanding in terms of method development and offer greater potential for retrospective analysis. However, to achieve reliable quantification at 0.010 mg·kg−1 levels in food matrices across a broad scope of pesticides, complex data acquisition strategies combining targeted and non-targeted MS2 workflows within a single run could be required (Rajski et al., 2021). While this approach enhances compound identification at regulatory limits, it also entails extended method development time and more complex data processing, highlighting the need for strategies that can improve sensitivity while preserving data acquisition flexibility.
Another key component of HRMS-based analyses of pesticide residues in food commodities is the chromatographic separation. Often, this part of the analytical workflow is relatively ignored in favour of the optimisation of the mass spectrometry data acquisition step. In recent times, liquid chromatography has progressively evolved from analytical-flow (column internal diameter (i.d.) 3.2–1.5 mm, flow rates 500–100 μL·min−1) towards lower-flow regimes, including micro-flow (column i.d. 1.5–0.5 mm, flow rates 100–10 μL·min−1) and nano-flow (column i.d. 0.15–0.01 mm, flow rates 1–0.1 μL·min−1) (Vasconcelos Soares Maciel et al., 2020). Although the boundaries between these flow regimes are not universally defined and remain subject to discussion in the literature, the practical classification proposed by Vasconcelos Soares Maciel et al. was adopted as an operational reference. The use of low flow rates enhances electrospray ionisation efficiency and reduces solvent consumption and waste generation. This miniaturisation has been driven largely by the demands of high-sensitivity applications in proteomics and metabolomics (Bian et al., 2020; Bian et al., 2021; Bian et al., 2022; Lenčo et al., 2018; Vargas Medina & Lanças, 2024). However, as with Orbitrap technology, in its early years the adoption of low-flow LC techniques in small-molecule analysis, particularly in regulatory fields such as food safety, remained limited despite their advantages. Traditionally, low-flow techniques, particularly nano-flow, have been considered less robust and associated with lower analytical throughput, leading laboratories to rely on higher-flow liquid chromatography methods. Advances in pumps, narrow-bore column technology and electrospray interfaces have largely mitigated these concerns, enabling stable and sensitive performance at nano- and micro-flow rates for small-molecule analyses (Girel et al., 2025; Mejía-Carmona et al., 2020; Vargas Medina et al., 2020; Vargas Medina & Lanças, 2024). Even so, very few studies have demonstrated the applicability of low-flow LC-HRMS to pesticide residue analysis in food, with some authors reporting the use of nano-flow LC coupled to Orbitrap-based HRMS for this purpose (Alcántara-Durán et al., 2018; Aydoğan & El Rassi, 2019; Mirabelli et al., 2016; Moreno-González et al., 2018; Moreno-González, Alcántara-Durán, et al., 2017; Moreno-González, Pérez-Ortega, et al., 2017).
The review of the literature indicates that, while nano- and micro-flow LC-MS approaches have been previously explored for pesticide analysis, their application to broad-scope multiresidue workflows using HRMS remains limited. In this context, the present study investigates whether miniaturising the chromatographic flow can improve overall sensitivity and thereby enable a more straightforward and versatile non-targeted data acquisition workflow, without compromising analytical performance, in response to the growing demand for higher sensitivity and efficiency in HRMS-based pesticide residue analysis. A micro-flow LC-Q-Orbitrap-HRMS method was developed, integrating a streamlined full-scan, variable data-independent acquisition (vDIA), and data-dependent MS2 (ddMS2) workflow to achieve regulatory quantification limits for a broad spectrum of pesticides in fruit and vegetable matrices. The method was comprehensively evaluated in terms of retention time and peak area stability, sensitivity, linearity, and matrix effects across tomato, orange, and avocado. In addition, proficiency test materials and real samples were analysed to confirm the method's suitability for routine monitoring. Overall, the study aimed to demonstrate that coupling micro-flow LC to a Q-Orbitrap analyser provides a robust, sensitive, and operationally practical alternative for routine pesticide residue determination.
2. Materials and methods
2.3. Micro-flow LC-HRMS analysis
2.3.1. Micro-flow liquid chromatography
For the micro-flow LC analysis, a Thermo Scientific™ Vanquish™ Neo UHPLC system (Thermo Scientific™, Germering, Germany) set up in micro-flow mode with 50 μm i.d. nanoViper™ capillaries was used. The UHPLC system comprises a Binary Pump N with a built-in ProFlow™ XR flowmeter for active flow control, a Split Sampler NT with two 1500 bar 7-port 6-position valves (injection and solvent valves, respectively), a Column Compartment N with a 1500 bar 6-port 2-position switching valve, a solvent rack and a Vanquish System Controller connected to a Vanquish User Interface. The Standard Instrument Integration (SII) 1.8.0.530 for Xcalibur™ 4.7 software (Thermo Scientific™) was used for system control. The solvents used are listed in Table S1. The instrument was operated in ‘direct injection’ workflow, with outer needle wash settings and speed parameters set by default. Autosampler temperature was set at 7 °C.
2.3.2. Mass spectrometry data acquisition
A Thermo Scientific™ Orbitrap Exploris™ 240 (Bremen, Germany) mass spectrometer equipped with an OptaMax™ NG ion source with a heated-electrospray ionisation (H-ESI) probe and a 34-gauge stainless steel low-flow needle insert was used. The front-to-back position of the spray insert was adjusted to approximately 1.2 on a scale where 1 represents the front position (closest to the MS inlet) and 3 represents the back. The spray insert depth position was adjusted to Low-Medium on a scale from Low (lowest, closer to the MS inlet) to High (highest). The samples were analysed in positive ionisation mode only. The ion source parameters were set as follows: ion spray voltage: 3500 V, sheath gas: 25 (arbitrary units), aux gas: 5 (arbitrary units), sweep gas: 0 (arbitrary units), ion transfer tube temperature: 320 °C; vaporiser temperature: 125 °C. Advanced Peak Determination and Mild Trapping were set to ‘Enabled’. ‘EASY-IC™’ was selected for Internal Mass Calibration in ‘Run Start’ mode. Data acquisition workflow was a combination of MS and MS2 experiments. Firstly, to acquire MS data, the full scan mode was performed within a mass-to-charge ratio (m/z) range of 100 to 1000, with a resolving power (RP) of 90,000 full-width half-maximum (FWHM) at m/z 200. For the acquisition of MS2 data, the vDIA mode was used with an RP of 15,000 FWHM at m/z 200. Nine mass isolation windows were optimised: m/z 116–180, 179–240, 239–300, 299–360, 359–420, 419–480, 479–540, 539–747.5, and 747–1000. The lower boundary of the first window was slightly adjusted to include the in-source fragment of aldicarb (m/z 116.0528), ensuring comprehensive precursor coverage without affecting the overall window optimisation strategy. This optimisation was performed based on the precursor ions of the target pesticides, i.e., narrower windows were configured for m/z ranges with a greater number of precursor ions (between m/z 116 and 540), whereas wider windows were employed in the m/z ranges with fewer precursor ions (from m/z 540 and beyond). For further discussion, the reader is referred to a previous publication from our group (Manzano-Sánchez et al., 2024). The RP was reduced from 90,000 in MS mode to 15,000 for MS2 events to account for data acquisition speed, as keeping the RP constant would result in an inadequately long cycle time. In MS2 operating at RP ≥ 15,000, the main obstacle in feature identification is the co-elution of chemically related species with identical fragments. For instance, triazoles typically provide a fragment ion at m/z 70.0400 (C2H4N3+). Thus, even if the precursor ions are different, the identification of triazoles using two ions (e.g., a precursor ion from the full scan and a fragment ion from MS2 experiments) can be limited by co-elution. Therefore, increasing the number of acquisition windows, as well as optimising their ranges, can help overcome the complications arising from these co-elutions (see Fig. S1).
3. Results and discussion
3.2. Evaluation of the final data acquisition workflow
The final data acquisition workflow comprised one full scan event at 90,000 FWHM (m/z 200), followed by nine vDIA and two ddMS2 scans at 15,000 FWHM. The analytical cycle time was ≤700 ms, corresponding to a scan rate of ≥1.4 Hz, which was sufficient to provide an adequate number of scans per chromatographic peak for quantification purposes (see Fig. S5). This compromise between acquisition speed (number of scans per peak) and spectral detail (MS2 quality and coverage) ensured robust quantification at 0.010 mg·kg−1 and below, while maintaining sufficient spectral information for reliable identification. This hybrid acquisition scheme allowed simultaneous targeted quantification and non-targeted data collection within a single run. As an illustrative example, Fig. 1 shows the detection of tebuconazole at 0.015 mg·kg−1 in a real apple sample. Similar hybrid approaches including MS-vDIA-ddMS2 data acquisition workflows, sometimes called “DaDIA”, have been reported by others as well (Guo et al., 2021; Sun et al., 2021).
![Food Chemistry, Volume 508, Part B, 2026, 148447: Fig. 1. Example of a positive finding of tebuconazole (C16H22ON3Cl) at 0.015 mg·kg−1 in a real apple sample. Top panels: full scan (FS, m/z 100–1000) chromatographic trace, mass spectrum at the compound retention time (tR), and extracted ion chromatogram (XIC) of [M + H]+ (m/z 308.1524 ± 5 ppm). Middle panels: variable data-independent analysis (vDIA) experiment (m/z range 299–360) chromatographic trace, fragmentation spectrum at tR showing two fragment ions of tebuconazole (C2H4N3+, m/z 70.0400, −0.6 ppm; and C7H6Cl+, m/z 125.0153, −0.8 ppm), and XIC of the fragment ion at m/z 70.0400 ± 5 ppm. Bottom panels: data-dependent MS2 (ddMS2) event triggered for precursor m/z 308.1336 at 8.35 min and the corresponding MS2 spectrum at tR. Traces highlighted with a grey background indicate the quantifier and qualifier ions employed in routine quantification and identification. All vertical axes correspond to relative abundance (%). For clarity, spectra are displayed up to m/z 320, although FS and vDIA were acquired across wider ranges. Mass errors are expressed in ppm relative to theoretical m/z values.](https://labrulez.com/labrulez-bucket-strapi-h3hsga3/Food_Chemistry_Volume_508_Part_B_2026_148447_Fig_1_Example_of_a_positive_finding_of_tebuconazole_51ba4fa538_l.webp) Food Chemistry, Volume 508, Part B, 2026, 148447: Fig. 1. Example of a positive finding of tebuconazole (C16H22ON3Cl) at 0.015 mg·kg−1 in a real apple sample. Top panels: full scan (FS, m/z 100–1000) chromatographic trace, mass spectrum at the compound retention time (tR), and extracted ion chromatogram (XIC) of [M + H]+ (m/z 308.1524 ± 5 ppm). Middle panels: variable data-independent analysis (vDIA) experiment (m/z range 299–360) chromatographic trace, fragmentation spectrum at tR showing two fragment ions of tebuconazole (C2H4N3+, m/z 70.0400, −0.6 ppm; and C7H6Cl+, m/z 125.0153, −0.8 ppm), and XIC of the fragment ion at m/z 70.0400 ± 5 ppm. Bottom panels: data-dependent MS2 (ddMS2) event triggered for precursor m/z 308.1336 at 8.35 min and the corresponding MS2 spectrum at tR. Traces highlighted with a grey background indicate the quantifier and qualifier ions employed in routine quantification and identification. All vertical axes correspond to relative abundance (%). For clarity, spectra are displayed up to m/z 320, although FS and vDIA were acquired across wider ranges. Mass errors are expressed in ppm relative to theoretical m/z values.
Food Chemistry, Volume 508, Part B, 2026, 148447: Fig. 1. Example of a positive finding of tebuconazole (C16H22ON3Cl) at 0.015 mg·kg−1 in a real apple sample. Top panels: full scan (FS, m/z 100–1000) chromatographic trace, mass spectrum at the compound retention time (tR), and extracted ion chromatogram (XIC) of [M + H]+ (m/z 308.1524 ± 5 ppm). Middle panels: variable data-independent analysis (vDIA) experiment (m/z range 299–360) chromatographic trace, fragmentation spectrum at tR showing two fragment ions of tebuconazole (C2H4N3+, m/z 70.0400, −0.6 ppm; and C7H6Cl+, m/z 125.0153, −0.8 ppm), and XIC of the fragment ion at m/z 70.0400 ± 5 ppm. Bottom panels: data-dependent MS2 (ddMS2) event triggered for precursor m/z 308.1336 at 8.35 min and the corresponding MS2 spectrum at tR. Traces highlighted with a grey background indicate the quantifier and qualifier ions employed in routine quantification and identification. All vertical axes correspond to relative abundance (%). For clarity, spectra are displayed up to m/z 320, although FS and vDIA were acquired across wider ranges. Mass errors are expressed in ppm relative to theoretical m/z values.
3.3. Method performance
3.3.2. Sensitivity, linearity and matrix effects
Fig. 4 shows, for each matrix, the percentage of compounds detected at each calibration level, distinguishing between the quantifier ion (for most analytes the precursor in full scan MS) and the qualifier ion (for most analytes a fragment observed in vDIA MS2). Fig. 4 further illustrates that Q-Orbitrap HRMS generally provides higher sensitivity in MS than in MS2. As identification requires the presence of two ions, the practical iLOQ was determined by the lowest calibration level at which the qualifier ion was detected, as exemplified in Fig. 5. All 239 compounds were identified at 0.010 mg·kg−1 in all matrices; notably, a substantial number were identified at 0.001–0.002 mg·kg−1. Individual detection levels for the quantifier and qualifier ions for each compound in each matrix, together with the corresponding iLOQs, are provided in Table S5.
 Food Chemistry, Volume 508, Part B, 2026, 148447: Fig. 4. Comparison of detection levels for quantifier and qualifier ions in representative matrices; instrumental limits of quantification (iLOQs) correspond to the qualifier ion.
![Food Chemistry, Volume 508, Part B, 2026, 148447: Fig. 5. Example illustrating how the instrumental limit of quantification (iLOQ) is defined by the qualifier ion, using fipronil (C12H4Cl2F6N4OS) as a representative compound. Extracted ion chromatograms (exact m/z ± 5 ppm) are shown at increasing concentration levels in the three evaluates matrices (tomato, orange and avocado). The quantifier ion corresponding to the precursor [M + NH4]+ at m/z 453.9725 acquired in the full scan event (black trace), and the qualifier ion corresponding to the fragment ion C11H5Cl2F3N4OS+ at m/z 367.9508 acquired in vDIA (isolation window m/z 419–480, red trace). Although the quantifier ion is detectable at lower concentrations, identification requires the simultaneous presence of both ions. Therefore, the iLOQ corresponds to the lowest calibration level at which the qualifier ion is detected. (For interpretation of the references to colour in this figure legend, the reader is referred to the web version of this article.)](https://labrulez.com/labrulez-bucket-strapi-h3hsga3/Food_Chemistry_Volume_508_Part_B_2026_148447_Fig_5_Example_illustrating_how_the_instrumental_limit_of_quantification_i_LOQ_is_defined_by_the_qualifier_ion_using_fipronil_a429f86644_l.webp) Food Chemistry, Volume 508, Part B, 2026, 148447: Fig. 5. Example illustrating how the instrumental limit of quantification (iLOQ) is defined by the qualifier ion, using fipronil (C12H4Cl2F6N4OS) as a representative compound. Extracted ion chromatograms (exact m/z ± 5 ppm) are shown at increasing concentration levels in the three evaluates matrices (tomato, orange and avocado). The quantifier ion corresponding to the precursor [M + NH4]+ at m/z 453.9725 acquired in the full scan event (black trace), and the qualifier ion corresponding to the fragment ion C11H5Cl2F3N4OS+ at m/z 367.9508 acquired in vDIA (isolation window m/z 419–480, red trace). Although the quantifier ion is detectable at lower concentrations, identification requires the simultaneous presence of both ions. Therefore, the iLOQ corresponds to the lowest calibration level at which the qualifier ion is detected. (For interpretation of the references to colour in this figure legend, the reader is referred to the web version of this article.)
Food Chemistry, Volume 508, Part B, 2026, 148447: Fig. 5. Example illustrating how the instrumental limit of quantification (iLOQ) is defined by the qualifier ion, using fipronil (C12H4Cl2F6N4OS) as a representative compound. Extracted ion chromatograms (exact m/z ± 5 ppm) are shown at increasing concentration levels in the three evaluates matrices (tomato, orange and avocado). The quantifier ion corresponding to the precursor [M + NH4]+ at m/z 453.9725 acquired in the full scan event (black trace), and the qualifier ion corresponding to the fragment ion C11H5Cl2F3N4OS+ at m/z 367.9508 acquired in vDIA (isolation window m/z 419–480, red trace). Although the quantifier ion is detectable at lower concentrations, identification requires the simultaneous presence of both ions. Therefore, the iLOQ corresponds to the lowest calibration level at which the qualifier ion is detected. (For interpretation of the references to colour in this figure legend, the reader is referred to the web version of this article.)
3.4. Analysis of proficiency test and real samples
To evaluate the performance of the developed method under external quality assessment, a set of four proficiency test (PT) samples was analysed. All estimated z-scores were within the satisfactory range (≤|2.0|), demonstrating the robustness of the workflow in an interlaboratory context (Table S6).
In addition to PT samples, the method was applied to 25 real fruit and vegetable samples from the European monitoring programme. These samples had previously been internally analysed using an analytical-flow LC-QqQ-MS/MS system accredited under ISO/IEC 17025 and were known to contain at least one pesticide residue at quantifiable concentrations. Results obtained with the micro-flow LC-HRMS platform for 29 different compounds were comparable to those from the analytical-flow LC-QqQ-MS/MS platform, with typical differences of less than 30% (see Table S7 and Table S8). The micro-flow LC-HRMS workflow developed in this study provided comparable results for a large number of pesticides in terms of detection, identification, and quantification. Although triple quadrupole systems generally offer higher absolute sensitivity, the present method achieved detection limits approaching those typically obtained with these instruments, while delivering substantially richer spectral information. This high level of mass spectrometric detail not only supports targeted quantification workflows but also enables seamless extension to suspect screening and non-targeted analysis without any modification of the HRMS acquisition setup. Overall, the method offers excellent sensitivity and outstanding spectral coverage, both of which are critical for comprehensive pesticide residue monitoring in complex food matrices.
4. Conclusions
In conclusion, coupling micro-flow LC with a Q-Orbitrap high-resolution mass spectrometer proved to be an effective strategy for multiresidue pesticide analysis in fruits and vegetables. The sensitivity achieved under micro-flow LC conditions (0.3 mm internal diameter column operated at 15 μL·min−1) allowed the HRMS system to be operated using a non-targeted data acquisition workflow, based on full scan and vDIA and complemented by ddMS2 events, without relying on targeted scan modes. Under these conditions, robust targeted quantification was achieved for 239 pesticides at or below 0.010 mg·kg−1, while preserving comprehensive non-targeted data collection within a single run, supporting the possibility of retrospective suspect screening and non-targeted analysis based on the same dataset. The method exhibited excellent retention time stability and area repeatability, broad linear ranges, and generally low matrix effects across tomato, orange and avocado extracts. External assessment using proficiency test samples and comparison of results of 25 real samples with an accredited analytical-flow LC-QqQ-MS/MS method confirmed its accuracy and reliability. Indeed, the results were comparable to a triple quadrupole in terms of detection and quantification for the pesticides within the scope. Moreover, the HRMS approach enabled a more comprehensive sample evaluation, supported by high mass accuracy (mass errors ≤ ±5 ppm), which is not attainable with low-resolution instruments. In addition, the micro-flow configuration substantially reduced solvent consumption and the generation of organic waste, contributing to a more sustainable analytical strategy. Overall, the results support the use of micro-flow LC-HRMS as a robust, sensitive, and efficient tool for routine monitoring of pesticide residues in complex food matrices.