Mo, 10.8.2026 | Original article from: Int. J. Mol. Sci. 2026, 27(4), 1926
Mass spectrometry-based lipidomics identifies distinct plasma lipid changes linked to long-term aromatase inhibitor therapy in postmenopausal breast cancer patients.Aromatase Inhibitor Therapy Is Associated with Distinct Plasma Lipidomic Profiles in Postmenopausal Breast Cancer Patients
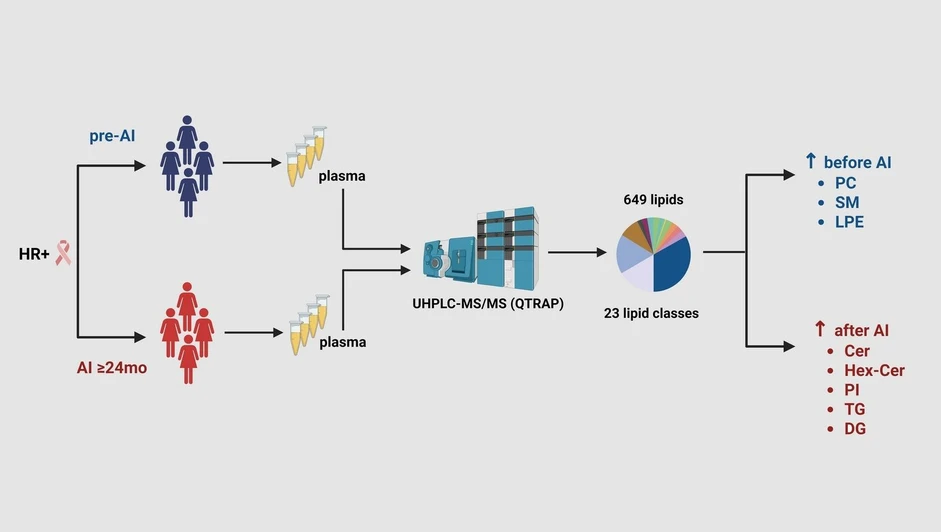
Int. J. Mol. Sci. 2026, 27(4), 1926: Graphical abstract
This study uses ultra-high-performance liquid chromatography–tandem mass spectrometry (UHPLC-MS/MS) lipidomics to characterize plasma lipid alterations associated with long-term aromatase inhibitor therapy in postmenopausal breast cancer patients. A total of 649 lipid species across 23 classes and subclasses were relatively quantified, revealing significant differences in phosphatidylcholines, sphingomyelins, ceramides, hexosylceramides, and other lipid groups.
Multivariate analysis showed clear group separation, while a Naive Bayes model based on lipid-class profiles achieved an AUC of 0.79. The results indicate that aromatase inhibitor therapy is associated with systematic lipidomic changes linked to estrogen deprivation and sphingolipid metabolism, providing potential mechanistic insight into long-term metabolic effects of treatment.
The original article
Aromatase Inhibitor Therapy Is Associated with Distinct Plasma Lipidomic Profiles in Postmenopausal Breast Cancer Patients
Int. J. Mol. Sci. 2026, 27(4), 1926
https://doi.org/10.3390/ijms27041926
licensed under CC-BY 4.0
Selected sections from the article follow. Formats and hyperlinks were adapted from the original.
Breast cancer (BRC) is the most common malignancy among women, with over 2.2 million new cases diagnosed globally in 2022 [1]. A substantial proportion of breast cancers are estrogen receptor-positive (ER+) and/or progesterone receptor-positive (PR+) [2], necessitating multimodal treatment approaches, including surgery, chemotherapy, radiotherapy, and endocrine therapy. Aromatase inhibitors (AIs) represent the gold-standard adjuvant endocrine treatment for postmenopausal women, as they improve disease control and reduce the risk of distant metastasis by inhibiting peripheral aromatase activity [3]. This inhibition prevents the conversion of androgenic precursors into estrogens in peripheral tissues, resulting in a marked reduction in systemic estrogen levels. For postmenopausal women with ER+ and PR+ breast tumors, a five-year course of AI therapy, often extended beyond this duration, is recommended to reduce the risk of disease recurrence [4].
AIs decrease plasma and tissue concentrations of endogenous estrogens by inhibiting aromatase (cytochrome P450), the rate-limiting enzyme responsible for estrogen biosynthesis from testosterone and adrenal androgens [5]. Because estrogen plays a protective role in lipid metabolism, AI therapy is frequently associated with dyslipidemia. Increased levels of triglycerides (TG), total cholesterol (TC), and low-density lipoprotein cholesterol (LDL) have been reported in patients receiving AIs [6], thereby increasing the risk of cardiovascular disease (CVD) in postmenopausal women with BRC [7].
Disturbances in lipid metabolism are recognized as a hallmark of cancer, leading to increasing interest in lipidomic profiling as a tool for characterizing tumor-associated metabolic alterations [8]. In recent years, clinical lipidomics studies have been conducted across multiple malignancies, including lung [9], pancreatic [10], renal cell carcinoma [11], colorectal [12], and BRC [13], highlighting cancer-specific lipidomic signatures and the growing relevance of lipid metabolism in oncology. Lipidomic reprogramming is now recognized as a defining feature of BRC. To date, elevated levels of phosphatidylcholine (PC 32:1), stearic acid, and ceramide (Cer 43:1), along with reduced levels of diacylglycerol (DG 34:2), have been reported in BRC patients compared with healthy women [14]. These lipid species, together with phosphatidylinositol (PI 16:0/16:1) and PI (18:0/20:4), have been proposed as potential biomarkers for BRC [14].
Despite these advances, there remains a paucity of studies investigating the lipidomic profiles in BRC patients in relation to endocrine therapy. The present cross-sectional study aims to address this gap by conducting mass spectrometry-based profiling of lipid classes and comparing profiles between postmenopausal BRC patients receiving AI therapy and another cohort assessed before this treatment. This approach aims to characterize associations between AI therapy status and plasma lipidomic patterns.
2. Results
2.3. Lipidomic Analysis
Plasma lipid profiling identified 649 lipids across 23 lipid classes and subclasses, covering the major structural families of the circulating lipidome, including neutral lipids (triacylglycerols, diacylglycerols, cholesteryl esters, and cholesterol), glycerophospholipids (phosphatidylcholines, phosphatidylethanolamines, phosphatidylinositols, phosphatidylglycerols, phosphatidylserines, and their lysophospholipid counterparts), sphingolipids (sphingomyelins, ceramides, monohexosylceramides, and dihexosylceramides), and free fatty acids. In addition to diacyl phospholipids, the dataset included ether-linked and plasmalogen species (denoted as O- and P-), most prominently within PC, PE, and LPC and LPE classes. An overview of the plasma lipidome is shown as a global lipid network (Figure 1). To assess whether the observed lipid changes reflect coordinated remodeling rather than isolated signals, we performed Fisher’s combined probability test at the lipid-class level. This analysis revealed significant cumulative differences in several lipid classes, including Cer, LPC, ether/plasmalogen LPC, LPE, and SM (Figure 1), supporting systematic class-level alterations despite limited power at the single-species level.
 Int. J. Mol. Sci. 2026, 27(4), 1926: Figure 1. Global lipid network analysis of plasma lipidomic differences between breast cancer patients (BRC) prior to initiation of the aromatase inhibitor (AI) therapy and patients receiving AI. Cytoscape-based network visualization illustrates lipid species grouped according to structural similarity and lipid class. Each node represents an individual lipid species, while edges indicate class-based relationships. Node size corresponds to the −log10 p-value from the Mann–Whitney U test, reflecting the statistical significance (−log p-Value > 1.3) of differences between groups. Node color indicates the direction and magnitude of change, based on log2 fold change, with red representing higher abundance in AI-treated patients and blue representing higher abundance in patients before AI therapy. Major lipid classes, including glycerophospholipids (GPL), sphingolipids (SP), glycerolipids (GL), fatty acids (FA), and cholesteryl esters (CE), are shown to highlight coordinated class- and species-level lipidomic alterations. Fisher’s combined p-value for individual lipid classes is shown at the bottom (significant p-Value < 0.05).
2.4. Multivariate Analysis of Plasma Lipidomic Profiles
Principal component analysis (PCA) and partial least squares discriminant analysis (OPLS-DA) were applied to the lipidomic dataset to assess global variation and group separation between the BRC and AI groups (Figure 2). PCA was performed as an unsupervised analysis, including all samples and quality control (QC) samples. The first two principal components explained 37.9% (PC1) and 15.6% (PC2) of the total variance, accounting for 53.5% of the cumulative variance. QC samples clustered tightly near the center of the PCA score plot, indicating analytical stability and reproducibility of the LC–MS measurements. In the PCA score plot, samples from the BRC and AI groups showed partial overlap, with no complete separation observed along the first two principal components. To further evaluate group discrimination, a supervised OPLS-DA model was constructed using the same dataset. The OPLS-DA score plot demonstrated improved separation between the BRC and AI groups along the first latent variable, with group-specific clustering highlighted by confidence ellipses. Permutation testing confirmed that the supervised OPLS-DA model was not overfitted, with a negative Q2 intercept (Q2 = −0.55), indicating that permuted models lacked predictive ability compared with the original model (Supplementary Figure S1). Together, these multivariate analyses indicate differences in lipidomic profiles between the BRC and AI groups, while also demonstrating acceptable analytical performance as evidenced by the clustering of QC samples.
 Int. J. Mol. Sci. 2026, 27(4), 1926: Figure 2. Multivariate analysis of plasma lipidomic profiles in breast cancer patients (BRC) prior to initiation of the aromatase inhibitor (AI) therapy and patients receiving AI. Principal component analysis (PCA) score plot (a) shows the distribution of plasma lipidomic profiles from patients before AI therapy (BRC, blue), patients receiving AI therapy (AI, red), and quality control samples (QC, gray). Orthogonal partial least squares–discriminant analysis (OPLS-DA) score plot (b) demonstrates improved separation between BRC and AI groups. The ellipse represents the 95% Hotelling’s T2 confidence interval.
4. Materials and Methods
4.5. Lipidomic Analysis
Chromatographic separation was performed using an ultra-high-performance liquid chromatography (UHPLC) ExionLC system (SCIEX, Framingham, MA, USA) coupled to a QTRAP® 6500+ mass spectrometer (SCIEX, Framingham, MA, USA). Lipids were separated on an ACQUITY Premier BEH C8 column (100 × 2.1 mm, 1.7 μm; Waters Corporation, Wilmslow, UK). The column temperature was kept at 55 °C, and the autosampler was set to 10 °C. The mobile phases consisted of solvent A (acetonitrile/water, 6:4, v/v, containing 10 mM ammonium acetate) and solvent B (isopropanol/acetonitrile, 9:1, v/v, containing 10 mM ammonium acetate), delivered at a flow rate of 0.4 mL/min. The total analytical run time was 20 min per sample. Data acquisition was carried out using Analyst software (version 1.6.2), and data processing and semiautomatic peak integration were performed with MultiQuant software (version 3.0; SCIEX, Framingham, MA, USA). Samples were analyzed in a randomized sequence with continuous monitoring of quality control samples. Raw peak areas were QC-normalized by LOESS [48] and IS-normalized by the corresponding IS class for each lipid.
4.6. Statistical Analysis
The data were processed using the Metabol package [48] in R program (v 3.6.3). Preprocessing of the data included locally estimated scatterplot smoothing (LOESS), Pareto scaling, filtering of analytes (coefficients of variation in the QC above 30%), mean centering, and the lnPQN normalization (Supplementary Table S1) [49]. Univariate statistical analysis (based on the non-parametric non-paired Mann–Whitney U test (p-values shown as −log) together with the log2 fold-change in medians) was performed and visualized using GraphPad Prism (version 9.0, GraphPad Software, LLC, Boston, MA, USA). Data were also evaluated using multivariate statistical analysis, namely the principal component analysis (PCA) and orthogonal discriminant analysis by partial least squares (OPLS-DA) and validated by permutation using SIMCA software (version 18.0, Sartorius Umetrics, Umeå, Sweden). Benjamini–Hochberg correction was used for false discovery rate correction. Detected lipid species were mapped to standardized lipid classes and subclasses according to accepted lipidomics nomenclature, enabling consistent grouping of lipid species for downstream statistical, class-level, and network analyses. LipidOne 2.4 was further used to support lipid-centric data integration and visualization prior to multivariate and pathway-based analyses (such as heatmaps, ROC analyses using a Naive-Bayesian model and Logistic Regression model, and protein–protein interaction network based on lipidomics data) [50]. Lipid network visualization was performed using Cytoscape software (v 3.8.2) [51]. Differentially abundant lipid species were organized according to lipid class and structural similarity. Node size reflected the −log10 p-value from univariate analysis, while node color represented log2 fold change between groups. Calculation of Fisher’s combined probability test for assessing systematic lipid class-level differences was performed (Supplementary Table S2) and calculated following procedures described previously [52].
5. Conclusions
In conclusion, our findings demonstrate significant alterations in lipid metabolism in BRC patients undergoing AI therapy, with pronounced changes in Cer, SM, DG, TG, PC, PI, and PE lipids and lipid classes. However, the precise mechanisms underlying the differences in lipid metabolism between patients before and during AI treatment remain to be fully elucidated. Future longitudinal studies with paired pre- and post-treatment samples from the same individuals leveraging comprehensive lipidomic profiling are needed to deepen our understanding of AI-induced metabolic alterations and to inform the development of targeted interventions aimed at mitigating adverse effects, ultimately improving long-term outcomes and quality of life for these patients.