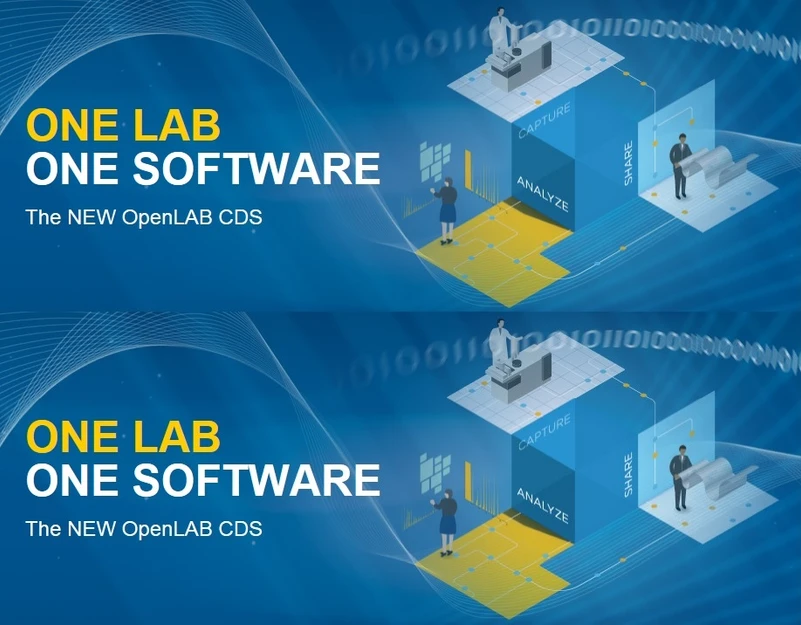
ZÁZNAM | Proběhlo Út, 19.5.2020
Prozkoumejte nový vzhled modulu pro analýzu dat. Jak vytvořit kalibrační křivku pro kvantifikaci? K čemu slouží nástroje Peak Explorer, vyhledávání v knihovnách a jak kombinovat informace z více měření?
Přejít na webinář
Agilent Technologies: OpenLab CDS Virtual Masterclass Series
Explore the new look and feel of the Data Analysis engine.
- Become acquainted with Integration Parameters and how to create a calibration curve for quantitation.
- Investigate new software tools such as Peak Explorer, UV and MS Spectral capabilities, library searching and matching, peak purity and more.
- Learn how to combine information from multiple results sets to track trends across time and instrumentation.